

Global Benefits Benchmarking: Unveiling Trends with Comparative Prevalence Analysis

This week's email is long, but we worked on a powerful concept of comparative Prevalence Analysis of benefits trends across global locations and wanted to share it. This methodology compares how frequently specific items (like benefits or features) occur across two groups or locations. First, it converts percentage data into binary categories (e.g., if an items prevalence is 5% or more, it gets coded as present; otherwise, it's coded as absent). These categories are then analyzed using logistic regression to calculate how likely each item is to be more common in one group compared to another.
The output clearly summarizes the analysis in a table, including each items prevalence in both groups, the calculated odds ratio (showing how much more likely an item is to appear in one location versus another), and a brief interpretation of impact.
Here is an example of comparison of Benefits across Seattle and NYC

- Seattle leads significantly in Remote work, On-site Clinics, Company Outings, and Stock Options or Equity.
- NYC offers notably higher Phone and Internet Bill Reimbursement and Dental Insurance benefits.
Here is an example of comparison of Benefits across London and Berlin
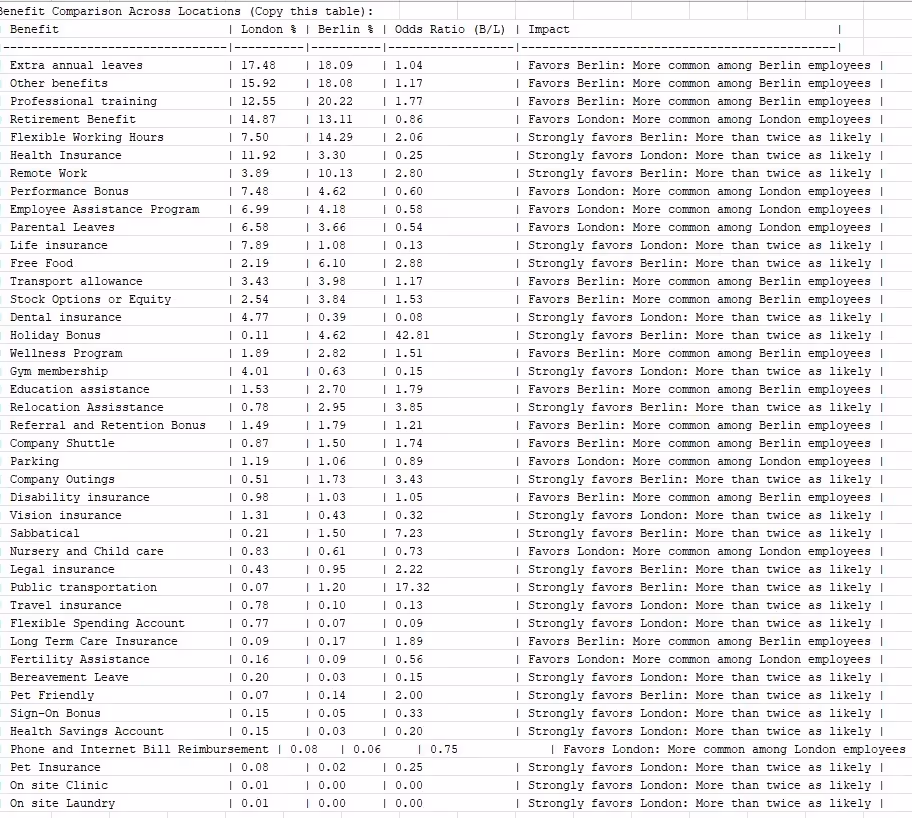
- Berlin strongly favors benefits like Sabbaticals, Wellness Programs, and Education Assistance.
- London is notably strong in providing Long-Term Care Insurance, Flexible Spending Accounts, and Fertility Assistance.
Here is an example of comparison of Benefits across Chennai, Bengaluru, Pune

- Bengaluru generally has the highest odds for benefits like Health Insurance, Parental Leaves, Life Insurance, and Health Insurance.
- Pune significantly leads in offering Nursery and Child Care (116% higher) and Flexible Spending benefits.
- Hyderabad excels in Legal insurance and Relocation Assistance.
- Chennai shows competitiveness but is typically close behind Bengaluru on key benefits.
We can analyze any set of benefits in your locations of interest.
Summary: Draup has developed a comparative prevalence analysis for benefits by locations that can be very helpful for customers. Let us know what you would like to analyze


.svg)


.svg)