

From Messy Salary Text to Global Compensation Intelligence
.svg)
How Draup Normalizes Pay Across 49 Countries with a Purpose Trained Gemma 3 (270 million parameter) Model

Compensation is the most direct signal of labor market reality. It shapes hiring velocity, offer acceptance, retention risk, and location strategy. For enterprise leaders, salary benchmarks are not “nice to have,” they are the inputs behind multi-million dollar workforce plans.
Yet salary data is also one of the least machine-friendly signals in the talent ecosystem.
That is because salary does not arrive as structured data. It shows up as free text inside job descriptions, written by humans for humans, influenced by local payroll conventions, cultural notation, tax terms, and recruiting habits. If you want compensation intelligence at global scale, you have to turn that text into consistent numbers, currencies, and pay frequencies that can be compared across markets.
That is exactly what Draup’s Salary Normalization solution does.
It takes unstructured salary text extracted from job descriptions and converts it into normalized compensation data across 49 countries(and growing), enabling accurate cross-market benchmarking, cost-of-talent analysis, and smarter workforce decisions for enterprise clients.
Why This Matters to Our Clients
Draup’s Fortune 1000 clients, including Microsoft, PepsiCo, Vodafone, PayPal, and Pfizer, rely on Draup for strategic talent intelligence that turns fragmented labor market signals into decisions they can act on. With normalized compensation data, Draup enables talent teams to move from reactive offer-making and manual benchmarking to proactive, market-calibrated workforce strategy across regions and roles.
Accurate, normalized compensation data enables them to:
- Benchmark compensation strategically: understand market-competitive salary ranges across regions, roles, and peer companies.
- Optimize location strategy: identify cost-effective talent hubs without compromising on skill availability or quality.
- Strengthen talent pipelines: make competitive offers that attract high-quality candidates while maintaining budget discipline.
- Inform workforce planning: align headcount plans and budget forecasts with reliable, comparable cost data.
The business challenge: Salary is everywhere, but it is not usable
Most organizations assume compensation data is straightforward: a currency, a range, a time unit. In the real world, that assumption breaks immediately.
Now consider the scale at which this becomes a business problem:
- Millions of job descriptions across regions and languages
- Thousands of employers, each with their own formatting style
- Country-specific conventions for numbers, currency symbols, and magnitude abbreviations
- Frequent mixing of salary with bonuses, incentives, allowances, and contract types
When you try to operationalize this for global benchmarking, the difficulty is not simply extracting salary mentions. The real work is interpretation and normalization.
At enterprise scale, even small parsing mistakes have outsized consequences. A single separator misread can shift salary values by 10x or 100x. A single currency ambiguity can place identical symbols into the wrong economy. A single pay-rate error can turn an hourly wage into a yearly salary, distorting an entire benchmark.
This is why salary normalization is not a cleanup task. It is a high-precision intelligence problem.
The complexity of salary normalization (and why rules fail)
Salary text varies dramatically across countries, industries, and job posting styles. Here are the core pain points that make this problem uniquely hard.
Inconsistent number formatting
Different regions use different separators for thousands and decimals, and those separators can carry opposite meanings.
Examples:
- Switzerland: €50'000.00 – €60'000.00
Apostrophes act as thousand separators, dots indicate decimals.
- Brazil: R$ 3.000,00 up to R$ 5.000,00
Dots indicate thousands, commas indicate decimals.
- Poland: 10 000 to 18 000 PLN net/month on B2B (or equivalent currency in USD/EUR)
Spaces can be separators, and currency may be referenced indirectly alongside tax and contract context.
- India: 16,000 - 25,000/- per month + Monthly Incentives + Yearly Bonus
Local suffixes like /- appear, and base pay is mixed with incentives and bonuses.
Why this matters: if a system misreads 3.000,00, it might interpret it as 3, 3.00, 3000, or 300000 depending on the logic. One error can invalidate an entire country benchmark.
Regional magnitude notations
Salary values often include country-specific abbreviations that require interpretation, not just extraction.
Examples:
- India: 2 Lac 50 thousand to 3 Lac 50 thousand P.A.
“Lac” is a regional unit (100,000). The phrase combines two magnitude styles and includes “P.A.” for per annum.
- Global shorthand: 23–42K CTC, $100K-$150K
“K” is common, “CTC” refers to cost-to-company and may include components beyond base pay.
Why this matters: magnitude notation is tied to compensation concept. “CTC” is not always equivalent to base salary. If you normalize without understanding, you create misleading comparisons.
Multiple salary ranges in a single text
Job descriptions often include multiple compensation structures, typically to show equivalents across pay frequencies or contract types.
Example:
- $72,152.53 – $101,299.48 per annum / $36.38 – $51.08 per hour
Why this matters: this is not one salary expression. It is two different ranges with different pay rates. A naive system may merge them, drop one, or average them, and each outcome corrupts the dataset.
Additional compensation components
Salary text frequently includes bonuses, allowances, and variable pay, sometimes explicitly, sometimes implicitly.
Example:
- 18,000 gross per year + variable: 15% if they meet objectives
Why this matters: if you treat this as base salary, you inflate benchmarks. If you ignore the variable component, you understate total compensation. The distinction affects compensation strategy, not just data cleanliness.
Mini case: how one formatting error can distort strategy
Imagine an enterprise workforce planning team comparing Brazil compensation for a role, using market ranges derived from job postings.
Job description salary text:
R$ 3.000,00 up to R$ 5.000,00
What it means (human interpretation):
3,000 to 5,000 BRL per month.
What a fragile rule-based parser might do:
Treat the dot as a decimal separator and the comma as a thousands separator (the opposite convention), producing values like 3.00 to 5.00 BRL, or incorrectly scaling the number.
Downstream impact:
- Market benchmark becomes drastically wrong
- Location cost estimates become unreliable
- Offers may be under-leveled (losing candidates) or over-leveled (wasting budget)
- Decision-makers lose trust in the data, and the system becomes unused
This is why salary normalization must be precise, globally aware, and stable with numeric outputs.
Draup’s solution: a two-stage pipeline built for scale and reliability
Draup solves salary normalization through a purpose-built pipeline that separates extraction from interpretation.
Stage 1: Salary text extraction (in-house NER)
Job descriptions first go through preprocessing (including language translations and normalization). Then Draup’s in-house NER system identifies and extracts salary text from job descriptions. This NER model is fine-tuned from a RoBERTa (Robustly Optimized BERT Pretraining Approach) base developed by Meta AI, which was continually pretrained on 60M+ job descriptions to recognize compensation patterns across varied formats and locales. The fine-tuned model builds on this foundation to extract 20+ entity types, including salary-related information.
Stage 2: Salary Normalization (Gemma 3 270M)
Extracted salary text is then processed by a custom-trained model that converts unstructured salary mentions into structured compensation data that can be queried, compared, and benchmarked.
What gets normalized:
- Currency symbol (for example $, €, ₹, R$)
- ISO currency code (for example USD, EUR, INR, BRL)
- Minimum salary amount (normalized numeric value)
- Maximum salary amount (normalized numeric value)
- Pay rate (Hourly, Daily, Weekly, Monthly, Yearly)
Example transformation
Input salary text:
"R$1,902.00 - r$3,600.00 per month"
Country: Brazil
Output:
{
  "currency": "R$",
  "iso_code": "BRL",
  "min_amount": 1902.0,
  "max_amount": 3600.0,
  "pay_rate": "MONTHLY"
}
This is the moment salary becomes analytics-ready.
The fully trained salary normalizer model is now open-source and available on HuggingFace.
Why Gemma 3 270M is the right engine for this job
Draup made an intentional choice: build on a smaller, efficient model that is purpose-trained for salary normalization, rather than relying on brittle rules or expensive, general-purpose LLMs.
Gemma 3 270M model summary:
- Decoder-only transformer with 270 million parameters
- 170 million parameters in the embedding matrix and around 100 million in transformer layers, improving inference efficiency since embeddings are not involved in per-token computation
- Vocabulary size of 256k tokens supports multilingual coverage and rare symbols, including currency symbols like $, €, and ₹
- 18 decoder transformer layers with embedding size of 640, contributing to efficiency
- Grouped Query Attention for efficient attention computation
From a business standpoint, that translates to cost-effective high-throughput inference, strong multilingual and symbol handling, and stable numeric outputs that do not distort compensation values.
Performance, validation, and global coverage
What we ended up with is an enterprise-grade system built for global variety.
- Training data: 47,591 salary examples across 49 countries
- Test data: 7,818 validation examples ensuring global coverage
- Accuracy: 94.9% on 7,818 test datapoints — measured across all 49 countries (~160 examples each), so no single market inflates the score. For every 100 salary strings, the model gets ~95 right.
- Quality assurance: four iterative refinement cycles with manual validation, entity-level accuracy measurement, and validated ISO currency mapping
Business impact: what normalized salary unlocks
When salary becomes structured, it becomes usable across the Draup platform.
Enhanced data quality
- Transforms salary text into structured, ‘queryable’ compensation data
- Eliminates inconsistencies in reporting
- Enables reliable cross-country comparisons
Operational efficiency
- Automates normalization that would otherwise require manual effort
- Scales to enterprise volumes for continuous enrichment
- Reduces time-to-insight for compensation analysis
Strategic decisions for enterprise leaders
- Compensation benchmarking by role, region, and company
- Location intelligence and cost-of-talent comparisons
- Competitive positioning analysis for workforce strategy
Real-world use cases of salary normalization
Workforce Planning Leaders
Scenario: A global technology company is evaluating locations for a new engineering center.
Solution: Draup's normalized salary data enables precise comparison of engineer compensation across candidate cities, Bangalore, Warsaw, Mexico City, and Singapore, revealing that Warsaw offers competitive talent at a fraction of San Francisco costs.
Outcome: Informed location decision backed by accurate, normalized salary data.
Talent Acquisition Teams
Scenario: A pharmaceutical company needs to hire specialized AI engineers but lacks visibility into competitive compensation ranges.
Solution: Normalized salary data from thousands of job postings reveals market-rate ranges for AI engineering roles across target regions.
Outcome: Competitive salary offers that attract top talent while maintaining budget discipline.
Compensation & Benefits Teams
Scenario: An enterprise client wants to benchmark their compensation bands against industry peers.
Solution: Normalized salary data enables apples-to-apples comparison across companies, roles, and regions.
Outcome: Data-driven compensation adjustments that improve talent retention and competitiveness.
Built into Draup, not bolted on: seamless integration across the platform
Salary normalization becomes truly valuable when it is not a standalone output, but a signal that flows directly into the workflows talent and workforce leaders already rely on.
Draup’s Salary Normalization solution integrates seamlessly with the broader Draup platform, enriching multiple modules with normalized compensation intelligence:
- Workforce Planning Module: provides compensation inputs for headcount cost modeling, budgeting, and scenario planning.
- Talent Intelligence Platform: enriches role and skill profiles with reliable salary ranges, improving market context for critical roles.
- Location Intelligence: powers cost-of-talent analysis for site selection and talent hub strategy.
- Peer Benchmarking: enables competitive compensation comparisons across companies, roles, and geographies.
The end-to-end data pipeline
The system is designed as an enterprise-ready pipeline that converts job description text into structured compensation data at scale:
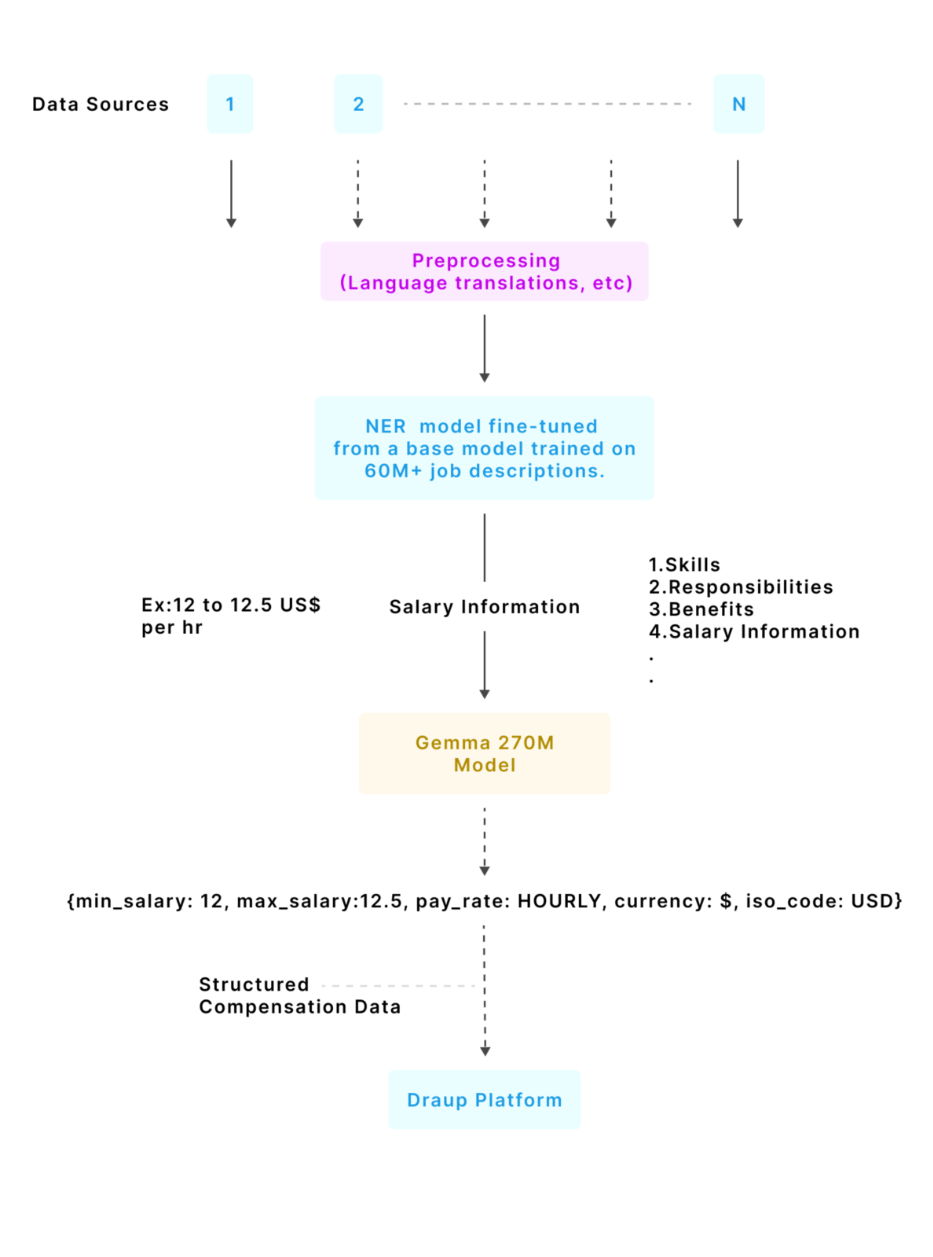
This ensures compensation signals are consistently captured, normalized, and made available across Draup’s intelligence layers without creating new manual workflows for customers.
Salary data will only grow messier as companies expand into new markets, hybrid compensation models evolve, and pay transparency regulations take hold globally. The systems that win won't be the ones that extract salary mentions — they'll be the ones that understand what those mentions actually mean, across every country, convention, and edge case.
Draup's Salary Normalizer is built for that reality: a purpose-trained system covering 49 countries today and will be available for more than 100 countries soon, with the architecture to scale as markets and regulations evolve. And because we believe this capability should push the industry forward, the fully trained model is open-source and available on HuggingFace.
If you're building workforce strategy on compensation data that hasn't been normalized at this level, you're building on assumptions. We'd rather you build on signal.
Related Articles


.svg)


.svg)