

Beyond Headcount: Workforce Planning Framework
A CFO-ready framework for Enterprise HR leaders
By filling up this form, you agree to allow Draup to share this data with our affiliates, subsidiaries and third parties


Executive summary
CEOs and CFOs do not think in terms of headcount – they think in terms of cost structures.
In enterprise settings, credibility increases when workforce plans are translated into the language executives use to run the business—how each hire maps into cost structure and reporting frameworks, not just headcount.
This matters now because compensation pressure remains structurally material in many enterprises. Gartner reported that 71% of CFOs planned to increase average employee compensation in 2024 faster than inflation. A subsequent Gartner finance survey noted that 61% of CFOs planned to increase average employee compensation in 2025 (down from 71% in 2024 and 86% in 2023), reinforcing that pay remains a persistent budgeting focus even as the pace moderates.
At the same time, labor market tightness continues to constrain supply in advanced economies; McKinsey estimates GDP in 2023 could have been 0.5% to 1.5% higher if employers had been able to fill excess vacancies—an indicator of persistent scarcity in many labor segments.
Against that backdrop, we provide an actionable framework and show how to operationalize each lens using the workforce intelligence capabilities we provide on our platform (real-time labor market intelligence, predictive modeling, and scenario planning).
Why Cost-Structure Fluency is the New Differentiator for SWP
BCG reported that nearly three-quarters of respondents cited people challenges and talent gaps as their biggest business obstacle, while strategic workforce planning ranked only 18th among 32 topics in current capabilities—highlighting a gap between business urgency and organizational readiness.
In parallel, BCG also noted that 75% plan to make significant investments in talent retention and development, raising the bar for proving ROI and financial alignment of workforce decisions.
Finance leaders increasingly expect the same rigor in talent decisions that they apply to capital decisions. McKinsey describes SWP as a mechanism that “links human resources, operations, and financial priorities” to enable dynamic, systemwide resource allocation.
And the broader enterprise budgeting environment remains tight even when certain budget categories rise: Forrester’s 2024 Planning Guides press release states 84% of US technology leaders expect a budget increase in 2024, with AI expected to “snag the biggest increase,” underscoring that investment shifts still demand prioritization discipline.
Implication: SWP and TA leaders who can translate talent strategy into cost structure, margin language, and scenario-backed tradeoffs become materially more effective business partners—because that’s the format executives use to allocate resources.
The 6-Lens Cost-Structure Framework: Operationalizing Talent Strategy
1. Balancing Fixed vs. Variable Costs for Scalability
The relevance to SWP and TA is that fixed costs drive long-term workforce commitments, while variable costs give flexibility in scaling teams.
a. Fixed Costs:
Salaries, benefits, infrastructure, compliance, licenses.
Expenses that remain relatively constant regardless of the production or sales volume, such as rent, salaries, and insurance premiums.
Recommendations:
- Model long-term headcount growth aligned to core revenue forecasts
- Invest in retention programs (career development, internal mobility) since replacing fixed-cost FTEs is more expensive
- Use workforce analytics to project the impact of wage inflation or benefit increases on long-term budgets.
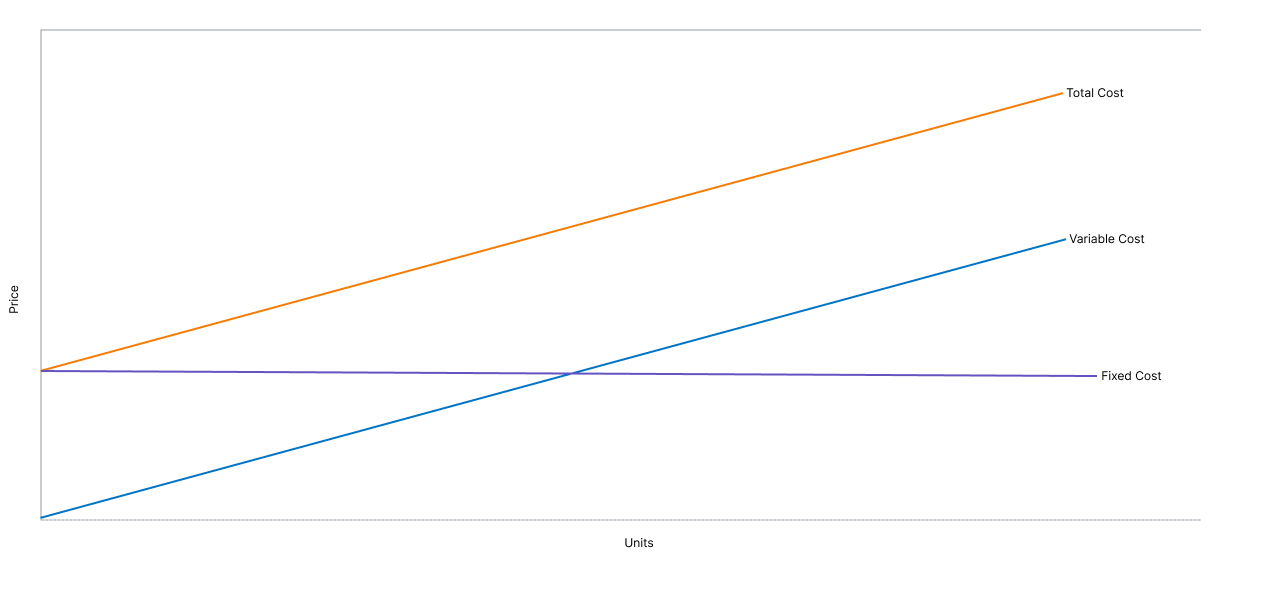
b. Variable Costs:
Contractors, outsourcing, recruitment agency spend, overtime, seasonal workforce.
Expenses that fluctuate in direct proportion to the level of production or sales, such as raw materials and sales commissions
Recommendations:
- Build a flexible contingent talent pool (contractors, gig platforms,staffing vendors) for surge capacity.
- Apply workforce scenario planning to identify which roles can shift between FTE and contingent models
- Negotiate vendor contracts with scalability in mind to optimize cost per hire.
- Implications (grounded in external research):
Everest Group reports that 80% of organizations plan to expand contingent workforce as a proportion of total workforce over the next 12–18 months—suggesting variable labor is increasingly a strategic lever, not an exception process.
How we operationalize this for our customers:
- Real-Time Intelligence: Continuous data on talent supply, demand, cost, and skills to make planning dynamic and evidence based.
- Predictive Role Modeling: Forecast how roles and skill mixes will evolve, and design reskilling or hiring plans before gaps appear.
- Integrated Scenario Planning: Align headcount, cost, and location strategies with business priorities using explainable AI-driven simulations.
This is the practical mechanism for converting “fixed vs. variable” from a finance concept into a workforce plan that can withstand changing demand.
2. Aligning with Organizational Reporting & P&L Accountability
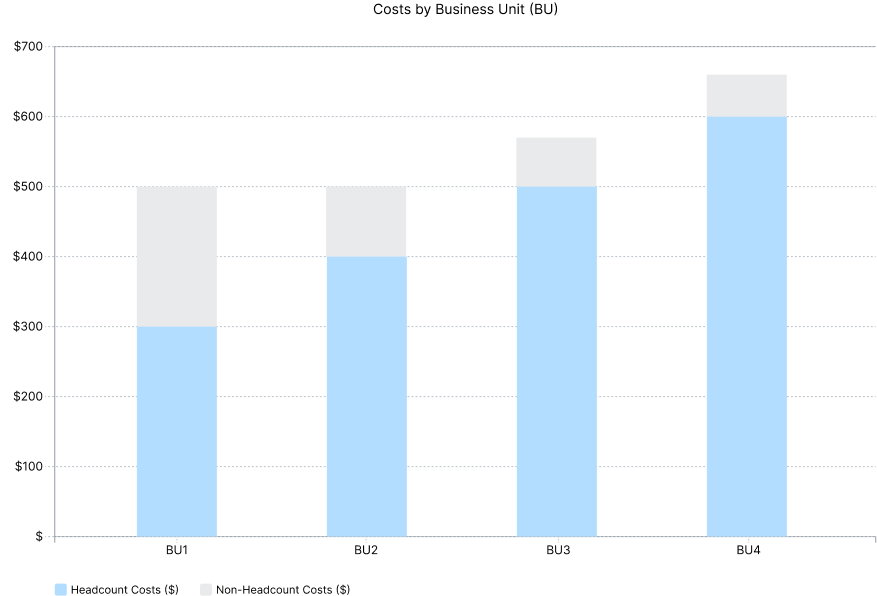
CEOs and CFOs manage costs by P&L accountability models, which are structured in different ways. Understanding whether hiring budgets sit with business units (BU), geographies, or corporate functions is critical to understanding demand and navigating approvals.
a. By Business Unit:
Separate P&Ls for different product lines or divisions.
For example: Microsoft has the following business units: Productivity and Business Processes, Intelligent Cloud, and More Personal Computing. Each business unit has its own HR/Recruitment needs and cost controls.
Recommendations:
- Partner with BU leaders to co-create workforce plans directly tied to BU growth targets
- Tailor recruiting KPIs per BU (e.g., engineering for Cloud, sales for Productivity).
b. By Geography:
Recruitment leaders must align with local wage structures, compliance, and talent pools. For example, the regional P&Ls may align to Americas, EMEA, and APAC regions.
Recommendations:
- Align compensation benchmarks with local market realities to stay competitive
- Localize recruitment branding to resonate with regional talent pools.
c. By Function:
Costs centralized by function. Recruitment reports into HR, but budgets are managed by functional demand. For example, HR, Finance, Manufacturing, Marketing, and Sales.
Recommendations:
- Create function-specific workforce capacity models (e.g., sales ramp rates, finance automation)
- Support shared services with cross-functional skills training to reduce duplication.
How we operationalize this with our platform:
We explicitly position a key enterprise problem as “Disconnected Planning”, where “HR, Finance, and Business units operate on different datasets, making workforce strategies hard to align to P&L outcomes.”
Our Workforce Planning Engine describes capabilities that support BU/geography/function views, including Talent Overview insights (talent size, demand, growth trends, hiring difficulty; wage benchmarks and skill maturity) and Compensation Range comparisons across percentiles, industries, and regions.
3. Categorizing Talent by P&L Cost Buckets (COGS, R&D, S&M, G&A)
CFOs typically organize company financials into four main cost buckets. Each P&L bucket has different workforce expectations. R&D requires long-term skill bets, G&A functions may be driven by medium term business and organizational growth expectations, S&M may be scaled up or down based on revenue performance, and COGS is driven by customer support, product manufacturing and service delivery requirements.

- Develop fast-hire pipelines for frontline and technical support roles.
- Explore automation and upskilling initiatives to reduce cost per unit delivered.
- Build talent strategies around scarce skill sets (AI, cloud, software engineering)
- Partner with universities/research hubs to create early-career pipelines.
- Align recruitment targets with sales growth projections by geography and segment.
- Monitor sales productivity metrics to optimize headcount vs. revenue ratios.
- Drive internal mobility programs for G&A functions to minimize external hiring.
- Support automation/outsourcing initiatives to keep corporate overhead lean.
Strategic note: Bain frames cost discipline as ensuring “every dollar you spend serves your strategy,” and states that zero-based budgeting can reduce costs by 20–40%. Even if an enterprise does not run a formal ZBB program, workforce planning narratives should anticipate that same scrutiny: “Which dollars, tied to which buckets, produce which outcomes?”
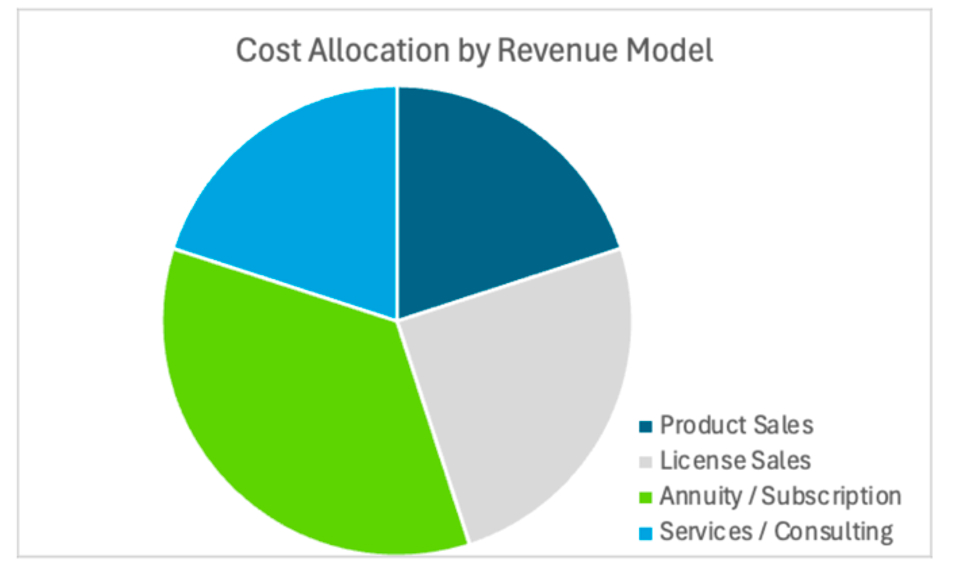
4. Mapping Workforce Investment to Revenue Stream Economics
CFOs want to see how costs align with types of revenue because each has different margin dynamics.
Costs include manufacturing,logistics, supply chain, warranties.
- Ensure skilled supply chain, logistics, and manufacturing talent pipelines.
- Build contingency hiring plans for product launch cycles.
- Invest in enterprise sales and partner enablement talent.
- Use recruitment to strengthen channel/partner management capabilities.
- Prioritize hiring in customer success, cloud operations, and renewals.
- Track customer lifetime value (LTV) to align staffing with retention economics.
Costs driven by billable headcount, delivery infrastructure, and partner ecosystems.
- Scale billable delivery talent in line with service pipeline forecasts.
- Create flexible deployment models (contract vs. full-time consultants)
How we should communicate upward:
Because CFOs track contribution margin and profitability by revenue stream to make scale/divest decisions, our workforce plans must reflect revenue-stream economics—not generic hiring demand.
5. Tailoring Strategy to Business Maturity: Efficiency vs. Growth
a. Legacy Business (core / cash cows):
Typically stable, lower growth, but high profitability. Costs are managed tightly, with focus on efficiency, automation, and low-cost offshoring. Workforce here is often optimized for stability and cost control.
Recommendations:
- Focus on cost-efficiency in recruitment, (ii) redeploy or reskill internal employees before external hiring
- Emphasize process automation and shared service models to control costs.
b. New / Emerging Business (growth engines):
This is usually loss-leading or lower margin at first and requires high upfront investment in R&D, GTM buildout, and hiring specialized talent. Workforce tilted toward innovation, cloud, AI, digital roles, entrepreneurial leadership.
Recommendations:
- Aggressively recruit for digital, AI, and cloud-native roles where speed-to- market is critical
- Adopt differentiated comp strategies to attract entrepreneurial/innovation talent,
- Build employer branding campaigns around innovation to attract scarce skills.
External anchor:
BlackRock’s analysis highlights that wage growth appears elevated and may settle structurally higher than the previous decade, an important consideration when deciding where to optimize vs. invest over multi-year horizons.

Navigating the C-Suite View on Structural Wage Inflation
CEOs and CFOs view wage inflation as a macro-economic force that directly impacts the company’s cost structure, competitiveness, and profitability. This is one of the most pressing workforce-related concerns, affecting both fixed and variable cost structures, and compounding year over year and eroding margins if not planned forcarefully. CEOs and CFOs zero in on three things: protecting margins, passing costs where possible, and sustaining competitiveness.
Executives want to understand how sustained wage increases affect long-term financial commitments, CFOs model how wage inflation erodes contributions margins in mature businesses, CEOs evaluate whether to rebalance the workforce across geographies to take advantage of lower wage markets, and companies consider how wage inflation narratives affect investor confidence.
Recommendations for SWP and Recruitment leaders
- Model inflation scenarios in advance to show how a 2% to 5% annual wage increase impacts fixed cost growth over three to five years, e.g., a sustained 3% annual wage inflation compounds to ~16% over five years.
- Demonstrate initiatives that offset inflation to reassure the leadership team that headcount costs remain efficient, e.g., Ai, automation, process redesign.
- Leverage variable talent models to position contingent, gig, and outsourcing options as buffers against wage-driven fixed cost escalation.
- Benchmark transparently, sharing competitive pay benchmarks proactively to help the C-suite make informed trade-offs between cost control and retention risks.
- Frame wage inflation in the language of gross margin, EBITDA, and unit economics, and not just as required wage increases.
External anchor:
Gartner notes ongoing compensation focus among CFOs (71% in 2024 faster-than-inflation increases; 61% planning increases in 2025).
BlackRock highlights the question of whether wage growth remains sticky—and points to analysis suggesting wages appear set to settle structurally higher than the prior decade.
Download the Cost-Structure Fluency Scorecard
Use the scorecard to self-assess whether your SWP or recruiting plan is expressed in a CFO-ready way across all six lenses from our CEO white paper.
By filling up this form, you agree to allow Draup to share this data with our affiliates, subsidiaries and third parties


The CFO Cost-Structure Lens:
A translation table we should use as the backbone of SWP narratives
Across all these views, CFOs track contribution margin and profitability by business unit and by revenue stream to decide what to scale, divest, or restructure. Recruitment leaders must differentiate talent pipelines, e.g., a push into SaaS means prioritizing CSMs and cloud engineers; a push into services means scaling delivery consultants.
Map hiring strategies to revenue stream needs:
- Product Sales: supply chain, manufacturing, field sales
- Licenses: enterprise sales, partner/channel enablement
- Subscriptions/Annuities: customer success, cloud operations, renewals
- Services/Consulting: billable talent pools, delivery centers
Model inflation scenarios, benchmark compensation, and design flexible talent models to balance retention vs. cost pressures
Conclusion: Securing Your Seat at the Executive Table
For SWP and recruitment leaders, fluency in cost structures is the new differentiator. It determines whether talent strategy is seen as a cost center or as a driver of enterprise value.
CEOs and CFOs are focused on margins, revenue models, and wage inflation. Leaders who can translate workforce dynamics into these financial terms earn credibility at the executive table.
Awareness of how costs flow through fixed vs. variable models, P&L buckets, revenue streams, and payroll growth creates a foundation for sustainable talent strategy. By integrating cost modeling, inflation scenarios, and workforce planning, SWP and recruitment leaders can position themselves as strategic partners driving agility, resilience, and long-term competitiveness.


.svg)


.svg)