

The Definitive Guide to Cost Structure Benchmarking for HR Leaders
A framework for enterprise HR leaders
By filling up this form, you agree to allow Draup to share this data with our affiliates, subsidiaries and third parties


Why Cost Structure Benchmarking is a Strategic Necessity
Every company eventually asks a version of the same question: Are we spending too much, too little, or about the right amount compared to peers? We built this guide to show HR leaders how cost structure benchmarking provides a systematic, fact-based way to answer it by comparing revenue, costs, and profitability to a basket of similar companies.
Benchmarking is not a reporting exercise. Done well, it becomes a strategic tool that guides resource allocation, informs board discussions, supports investor communications, and helps balance growth with profitability.
Principle: “Benchmarks are guides, not mandates.”
Why cost structure benchmarking matters now
Across industries, leadership teams are navigating persistent pressure to deliver growth while improving financial resilience. In Gartner research on CFO priorities, 56% of CFOs ranked enterprise-wide cost optimization targets in their top five actions, underscoring the urgency of cost scrutiny and trade-offs.
At the same time, cost pressure is not isolated to one line item. BCG analysis of more than 1,000 companies found one-third are seeing costs grow faster than revenue, eroding profitability.
Macro conditions compound the challenge. BlackRock Investment Institute’s outlook signals an expectation that inflation and interest-rate levels remain above pre-pandemic levels, raising the bar for disciplined spend and credible profitability narratives.
What this means for HR leaders: Talent is often the largest controllable cost. Yet most HR planning conversations still default to headcount and hiring plans, while executive conversations default to margin, productivity, and operating leverage. Benchmarking cost structures creates a common language to bridge those perspectives.
What cost structure benchmarking is (and isn’t)
Benchmarking cost structures compares your company’s revenue, costs, and profitability against a set of similar companies to understand efficiency, competitiveness, and potential improvement areas.
It is also explicitly strategic: it supports leadership decisions about where to invest, where to streamline, and how to explain those choices with clarity.
Benchmarking is not a one-time “answer.” We recommend treating it as a recurring management capability embedded into planning cycles, so leaders can respond more agilely to shifts in markets and operating conditions.
The Draup Framework:
6 Steps to Benchmark Cost Structures
We organize the benchmarking workflow into six steps. Each step is designed to keep the analysis defensible for Finance and usable for HR and business leaders.
Step 1: Defining the Scope and Decision Criteria
Benchmarking is most powerful when the objective is explicit: what decision will this change? Clarify scope, metrics, and the refresh cadence (annual or quarterly) before you begin.
Step 2: Selecting the Right Peer Group Filters
The foundation of meaningful benchmarking is choosing the right companies.
We use six filters to build an apples-to-apples basket:
- Industry peers
- Similar offerings (e.g., services vs. product)
- Business model alignment (avoid mixing fundamentally different models)
- Size matters (similar revenue band)
- Geographic scope (regional differences can drive structural differences)
- Exclude outliers (one-offs, restructures, different economics)
Step 3: Identifying Key P&L Metrics (COGS, R&D, G&A)
Benchmarking should start with high-level P&L lines, expressed as % of revenue to allow comparability:
- Revenue = Total sales.
- COGS (Cost of Goods Sold) = All direct costs of producing the goods or services that a company sells during a specific period.
- R&D (Research & Development) = Product development and innovation.
- S&M (Sales & Marketing) = growth and customer acquisition.
- G&A (General & Administrative) = corporate overhead such as HR and finance.
- EBITDA = operational profitability.
- Net Profit = bottom line profit after tax
Step 4: Normalizing Data for Accurate Comparison
- Identify competitors within your industry: Start broad, narrow by size, business model, and geography.
- Collect reliable data: Use public filings, industry reports, and trusted databases.
- Normalize: Convert data to % of revenue, standardize currencies, and adjust for accounting differences.
- Analyze: Compare averages, medians, ranges, and distributions. Example: Our R&D spend is 28% of revenue, while peers range 10-15% and spend 13% on average.
- Identify gaps and Interpret contextually: Higher-than-average R&D may be a deliberate growth investment, higher S&M may indicate aggressive growth or inefficiency, lower G&A reflects lean operations or underinvestment in operational controls.
- Implement and review: Use findings to drive actions, then refresh annually or quarterly
Step 5: Visualizing Results for Executive Buy-in
Clarity matters, especially for non-financial audiences.
We recommend using visuals that communicate both magnitude and variability:
- Stacked bar charts (peer averages vs. your company)
- Box-and-whisker plots (peer ranges)
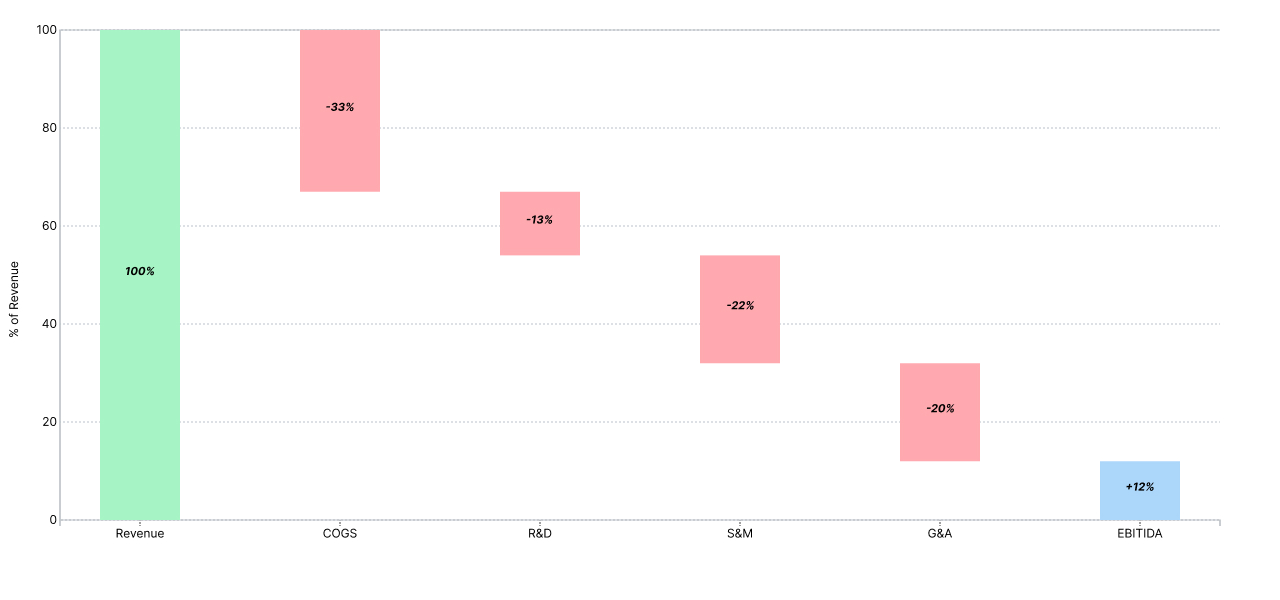
- Waterfall charts (walk from revenue to profit)
- Scatter plots (scale vs. cost intensity)
- Selection funnel diagrams (how peers were chosen)
Always pair visuals with plain-language takeaways (e.g., why a metric is above/below the peer median).
Step 6: Implementing Recurring Management Capabilities
Once high-level benchmarking is complete, refinements unlock greater value.
Common next cuts include:
- Gross margin analysis (break COGS into hosting/support/delivery)
- Sub-function splits (e.g., digital vs. field sales; innovation vs. maintenance in R&D)
- Regional benchmarks
- Stage-based benchmarks
- Unit economics (CAC, LTV, payback)
- Process/strategic benchmarking (productivity, conversion rates, onboarding, NPS)
For HR leaders, these refinements are where cost structure benchmarking becomes directly actionable: they connect P&L realities to org design, role mix, and productivity expectations.
Common challenges (and how to avoid them)
We see five failure modes repeatedly:
- Ambiguously defined scope
- Outdated data
- Comparability gaps across accounting
- Over-focusing on averages
- Lack of context and cross-functional buy-in
This is why we anchor the approach in defensible peer selection, normalization, and distribution-based analysis, and why we emphasize early partnership across HR, Finance, and business leaders.
Case example: from peer benchmarking to workforce decisions
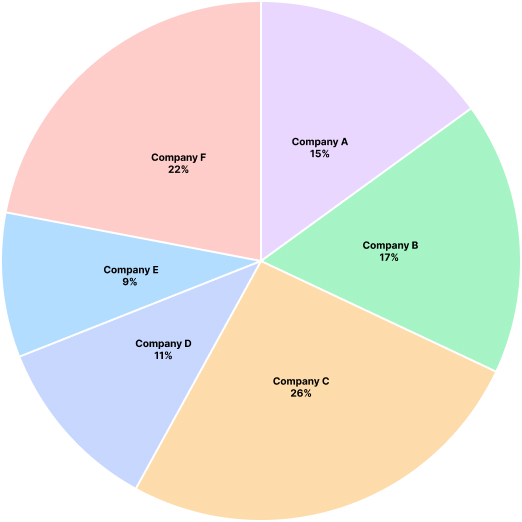
Benchmarking for a Market Information Services Company
We recently helped a customer benchmark against their peers in the Market Information Services space. They initially identified the following basket of companies, for which we sourced the latest annual financials from public databases such as Yahoo! Finance, Google Finance, Bloomberg, and from the company disclosures. We then translated all the financials to USD.
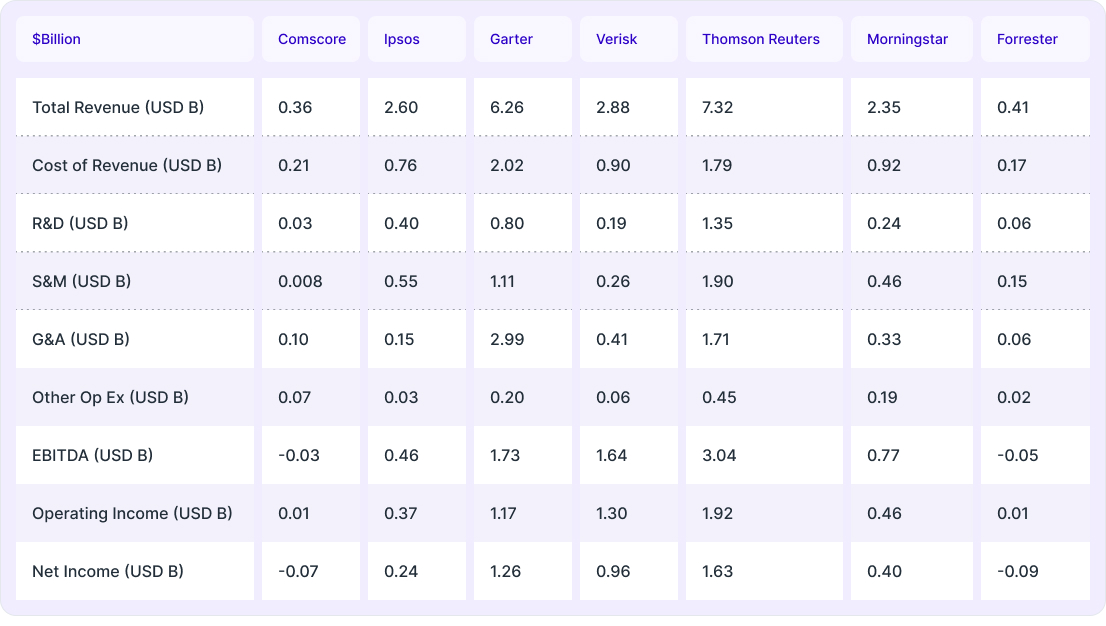
We then normalized by converting all numbers to % of the company’s revenue.
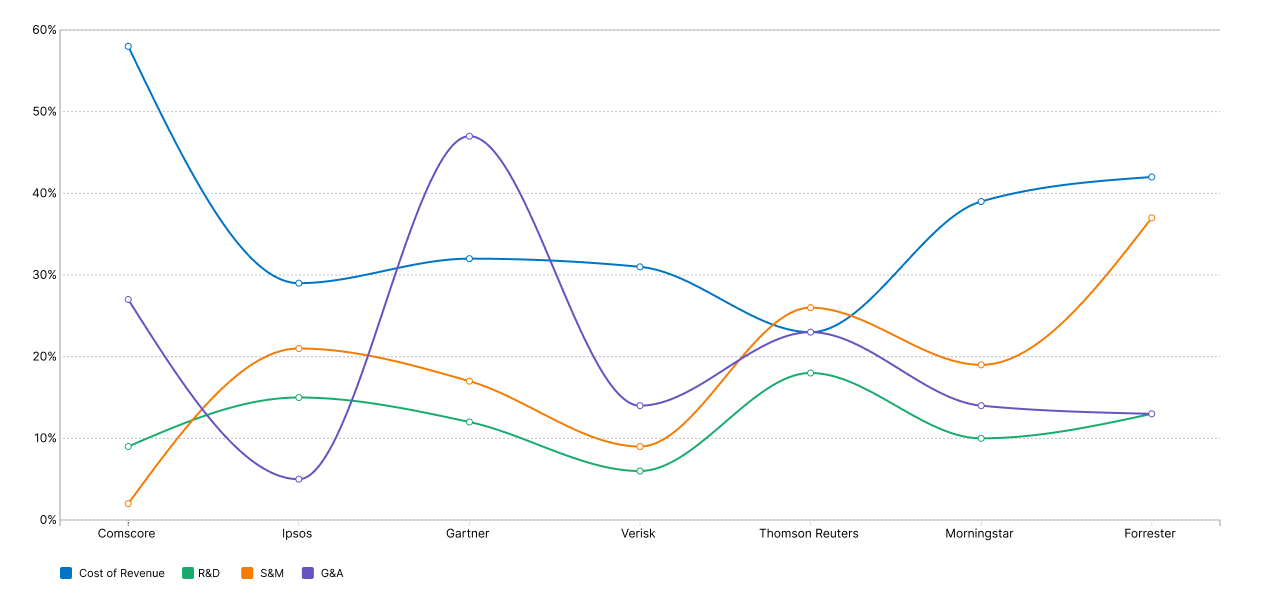
Comscore stood out as an Outlier, with much higher COGS structure than the others. This company is a vertical specialist (media), while the others are horizontal information services firms that provide research, analytics, and data across many industries. This makes it an outlier in the basket.
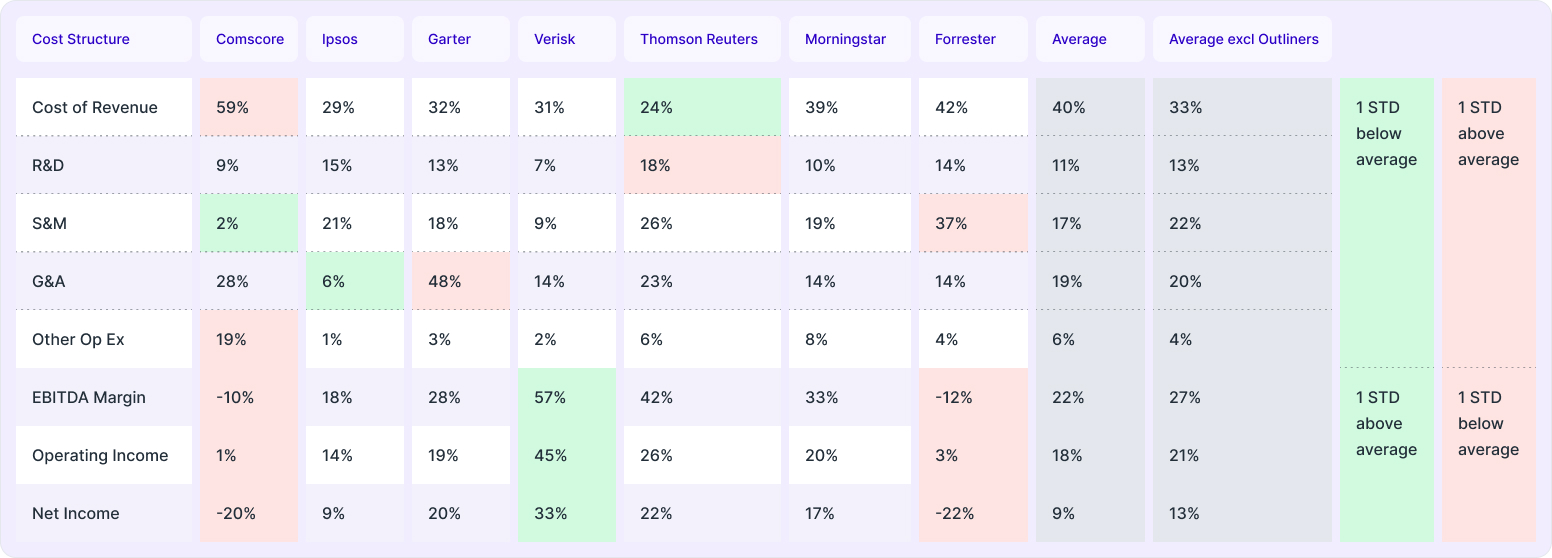
Peer Group Norms: Excluding the outlier Comscore, the peer group shows more balanced cost structures, with Cost of Revenue ~33%, R&D ~13%, S&M ~22%, and G&A ~20%. This provides a reliable baseline for horizontal information services firms.
Strategic Levers: Deviations highlight strategy choices:
- Higher R&D (Ipsos, Thomson Reuters) signals emphasis on innovation and product development.
- Elevated G&A (Gartner) reflects scaling overhead or investments in corporate functions.
- Low S&M (Comscore) suggests reliance on established client bases rather than aggressive customer acquisition.
Implications for Leaders: For HR and business executives, these patterns are not just financial but also reflect talent allocation priorities. High S&M spend implies large commercial headcount, while high R&D correlates with technical talent intensity. G&A efficiency, meanwhile, reflects HR, finance, and operational scalability.
From cost benchmarking to cost actions: workforce levers HR can influence
Benchmarking is most valuable when it becomes a bridge between finance and workforce planning; translating financial data into actionable workforce insight.
In practice, HR leaders typically have five “levers” to consider once gaps are understood:
- Workforce mix and role architecture (what work is done, by whom)
- Location strategy (where work is done)
- Employment model choices (FTE vs. alternative models where appropriate)
- Capability building (reskilling/upskilling vs. lateral hiring)
- Operating model and productivity (process redesign, automation, and managerial spans)l
Our research on cost-effective talent strategies in cloud roles highlights how these levers can show up in real-world planning, for example, identifying cost-effective locations, leveraging global centers, experimenting with alternative employment models, and using reskilling to reduce talent cost pressure.
How we enable defensible benchmarking and trusted decisions
Because cost benchmarking becomes a decision tool (not just analysis), trust in the underlying data and methodology matters.
On our platform, we explicitly document the practices we use to reduce inaccuracies and prevent misleading information through transparency and responsible data practices.
We also publish how we maintain data integrity and governance:
- We maintain a clean, accurate data environment by removing duplicates, outdated entities, and invalid records, using automated checks and analyst reviews.
- Our governance combines automated evaluations with Human-in-the-Loop reviews and cross-source checks to reduce bias before insights reach the platform.
- Our compensation insights use blended directional inputs and guardrails to prevent over-interpretation.
Finally, we build this on multi-dimensional labor and market data designed to support strategic workforce planning, predictive skills architecture, intelligent talent acquisition, and work redesign.
Conclusion: Building a Bridge Between Talent and Profitability
Benchmarking demonstrates that cost structures are as much about strategic choices and talent models as they are about financial discipline. For CHROs, this analysis provides a lens to evaluate whether people investments align with industry norms and competitive positioning. The case study demonstrates that while vertical specialists, such as Comscore, may diverge structurally, the broader peer group reveals consistent patterns that can inform workforce planning, productivity targets, and organizational design.
For CHROs partnering with CFOs and COOs, benchmarking becomes a bridge: translating financial data into actionable workforce insights. When used consistently, it empowers leadership teams to balance innovation with efficiency, ensure competitiveness in talent-heavy functions, and drive sustainable growth.


.svg)


.svg)