


AI Agent for Tech Strategy and Investment
Know Where They're Investing. Before the Budget Is Spent.
The AI sales agent that converts fragmented account data into a forward-looking technology investment map with signal-backed verdicts on every workload. Engage early on the bets that have real backing, and skip the ones that will never get funded.
By filling up this form, you agree to allow Draup to share this data with our affiliates, subsidiaries and third parties
Sellers pursue accounts without knowing where the technology budget is actually going
No View of Where Investment Is Actually Flowing
IT spend totals tell sellers nothing about which workloads have funded budget versus which are still aspirational.
Competitive Footprint Is Invisible
Knowing a competitor has 100 deals at an account does not show which workloads they own or where their coverage is thin.
Technology Signals Are Scattered Across Sources
Hiring trends, tech stack changes, and outsourcing deal counts live in separate systems and never get synthesized together.

No Build vs Buy Verdict by Workload
Without a workload-level classification, proposals land on capabilities the account is building internally rather than buying externally.


How This AI Sales Agent Works
The agent cross-references financial data, hiring signals, outsourcing deal counts, and tech stack movements to produce a workload-level investment map and a sequenced opportunity playbook.
Analyzes IT spend, revenue, and CAGR to establish whether the account is in transformation mode or maintenance mode.
Is this account's technology budget growing faster than revenue and what does that signal for timing?
Identifies funded technology priorities by cross-referencing earnings signals, hiring patterns, and news events.
Which priorities have committed budget and which are still aspirational?
Profiles key technology executives by role, tenure, and inferred agenda to identify the operational buyers for each priority.
Who owns the funded investment areas and who are the emerging decision-makers?
Synthesizes hiring data, outsourcing deals, and tech stack changes into a single evidence layer confirming active execution.
What does the hiring, outsourcing, and stack data tell us about where this account is actually spending?
Classifies every material workload as Build, Buy-Services, Buy-Products, or Hybrid with a verdict and evidence for each.
Which workloads is this account buying from external partners rather than building internally?
Projects the top upcoming investment areas with timing and confidence ratings based on converging signal evidence.
Which technology investments will reach procurement stage in the next 6, 12, and 24 months?
Identifies the top 3 opportunities with deal size estimates, conviction ratings, and a sequenced 3-move entry strategy.
Where do we focus pursuit energy and how do we move from delivery partner to transformation partner?
This AI Sales Agent is used by
1
Strategic Account Managers and Enterprise AEs
Enter every account review with a workload-level view of where investment is flowing.
2
Practice and Capability Leaders
Identify which practices align to funded priorities versus commoditizing workloads.
3
ABM and Demand Generation Teams
Target outreach to the executives who own the funded investment areas in the brief.
4
Deal Pursuit and Bid Teams
Build the pursuit case before an RFP is issued using the scored opportunity playbook.
5
Alliance and Partner Teams
Align co-sell motions to the tech stack transitions moving fastest at the account.
6
Revenue Operations and GTM Leaders
Score account prioritization using investment trajectory and workload classification data.
Accelerate Every Deal Cycle with AI Agents for Sales
Give your teams always-on agentic intelligence that speeds up every step of your GTM motion; from account identification to deal closure.
By filling up this form, you agree to allow Draup to share this data with our affiliates, subsidiaries and third parties


Unlock a complete Tech Strategy and Investment Intelligence brief for any account
Technology Strategy Snapshot
Transformation thesis, investment direction, seller position
Financial Capacity and Investment Trends
Revenue, IT spend, CAGR, and forecast
Strategic Priorities and Signals
Ranked priorities with dated evidence and owner
Material Signals (Last 6 Months)
Key events with seller implications
Leadership Influence Map
Executives with agenda and engagement hook
Three-Layer Execution Evidence
Hiring, outsourcing deals, and stack changes
Build vs Buy Workload Map
Every workload classified with verdict and evidence
12-24 Month Technology Outlook
Top 5 investment areas with timing and confidence
Opportunity Playbook
Top 3 opportunities with deal size and entry point
Entry Strategy
3-move sequenced path to strategic partner
Key Buyers and Stakeholders
Named buyers with opportunity and engagement hook
Impactful insights, delivered real-time
Access insights via API, custom data feeds, the Draup platform or using MCP
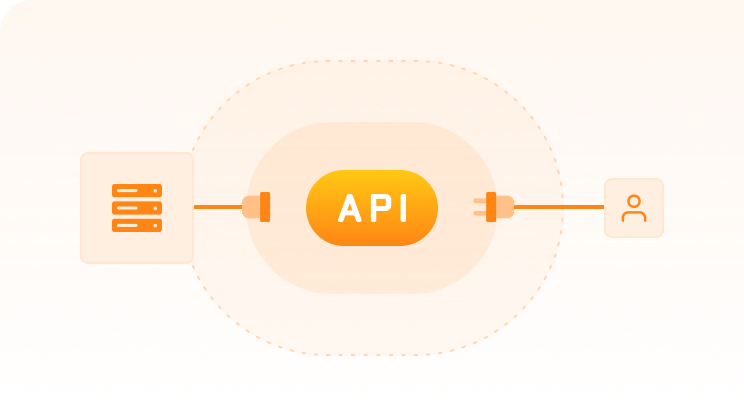
APIs & Integrations
Best for
Embedding live insights in workflows without storing data
- Native integrations with 33+ CRMs, like Salesforce, Hubspot, Microsoft Dynamics CRM, etc.
- Real-time access to critical data
- Enhanced security and data Integrity
- Efficient API performance with flexible limits
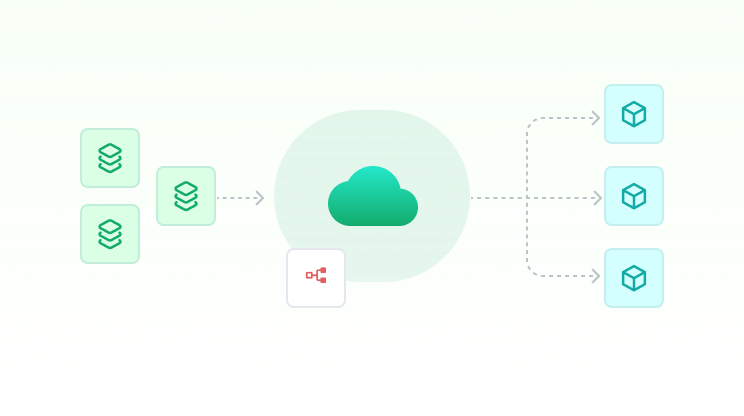
Custom Data Feed
Best for
Analytics at scale & joining Draup with internal data
- Highly customizable feeds for workflow needs
- Scheduled pushes to data lakes/warehouses (S3, ADLS, BigQuery, SFTP)
- Scalable use cases with the data
- Integrates with internal data assets for co-pilots/agents

Draup Platform
Best for
Fastest time-to-value,
no build required
- Ready-to-use UI with 200+ productized use cases & workflows
- Leverage visualizations & workflows to drive seller action with no overhead
- Enterprise controls: SSO, RBAC, governance
- Integrates UI & functionality into CRM apps
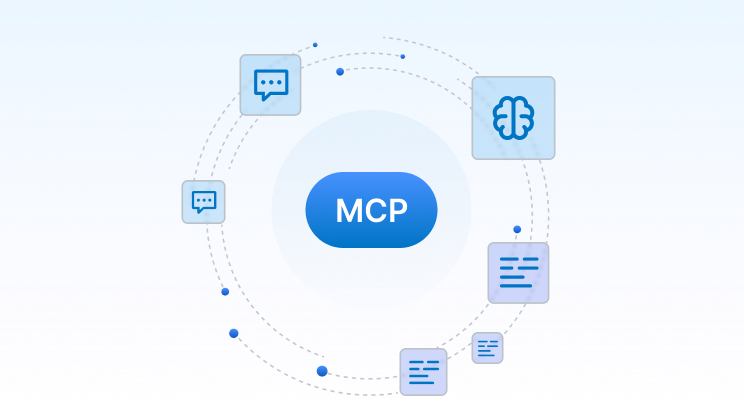
Model Context Protocol
Best for
Real-time Al workflows & LLM applications
- Native integration with Claude, OpenAl, and MCP-compatible Al tools
- Zero ETL, models query live data without pipelines or reindexing
- Governed access with token-based scopes, Pll masking, and audit trails
- Grounded, real-time data prevents LLMs from generating outdated or inaccurate insight
Enterprises do extraordinary things with Draup
Real stories. Real Success.


The Tech Strategy and Investment Intelligence agent is powered by unparalleled global market data


.svg)

.svg)
.svg)


.svg)


.svg)