


Account Prioritization that Finds the 10% Ready to Buy
Rank accounts by real-time fit, intent, and timing.
By filling up this form, you agree to allow Draup to share this data with our affiliates, subsidiaries and third parties
You can’t win a market by chasing every logo
Most aren’t buying; find the few that are

Random Outreach
Named-account lists are big, budgeted intent is small - leading to random activity and unorganized pipeline.

Limited Research
Hours wasted researching filings, news, job posts, and stacks → high cost-to-sell.

Prioritization Gaps
ABM and field motions aren’t aligned to where demand is forming (industry use cases, geo moves, vendor shifts).

Outdated Signals
Forecasts slip because deals aren’t tied to objective account triggers (renewals, exec moves, tech stack, outsourcing awards).

Prioritize Accounts with Signal-Driven Scoring
Draup ranks accounts by three explainable pillars
1
Fit
ICP match, firmographics, geo footprint & R&D locations, IT workforce density, and ecosystem context (industry drivers & emerging use cases)
2
Intent
Business Priorities, tech stack (1,500+ segments / 66K+ product & categories), outsourcing workloads & vendor map, real-time events, investment opportunities
3
Timing & Reachability
Executive movements, renewals, announcements, buyer-org coverage and influence, open access paths and new investment opportunities.
Find the 10% that gives you 90% of the revenue
Less chasing, more closing


Draup creates a updated, signal-driven ranking of accounts
Every prioritized account comes with reason codes: which signals fired, when, and suggested talktracks.

One-click Top-N lists
per region, product, or vertical.

Explainable scores
with reason codes and talk tracks.

Customizable weights
for fit, intent, and timing - tune by motion (net-new vs. expansion).

CRM integration
push scores, reason codes, and next best actions into Salesforce, HubSpot, or Marketo.

Built on Draup 360 data integrity
consolidated, de-duplicated, ghost-free profiles ensure accounts and buyer-org coverage are always accurate.
Enterprises do extraordinary things with Draup
Real stories. Real Success.


Powered by unparalleled global market data


.svg)

.svg)
.svg)


Impactful insights, delivered real-time
Access insights via API, custom data feeds, the Draup platform or using MCP
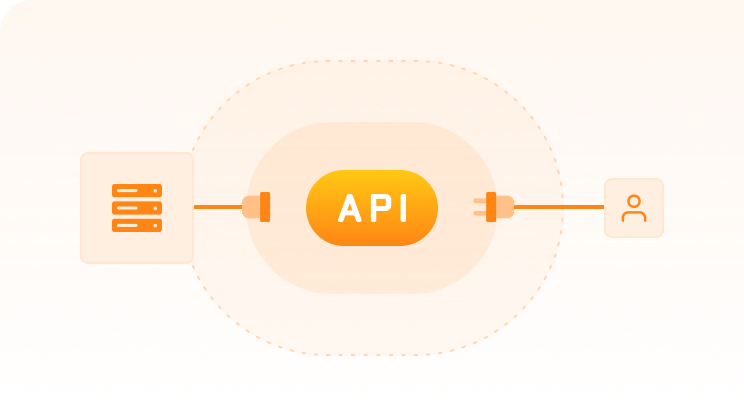
APIs & Integrations
Best for
Embedding live insights in workflows without storing data
- Native integrations with 33+ CRMs, like Salesforce, Hubspot, Microsoft Dynamics CRM, etc.
- Real-time access to critical data
- Enhanced security and data Integrity
- Efficient API performance with flexible limits
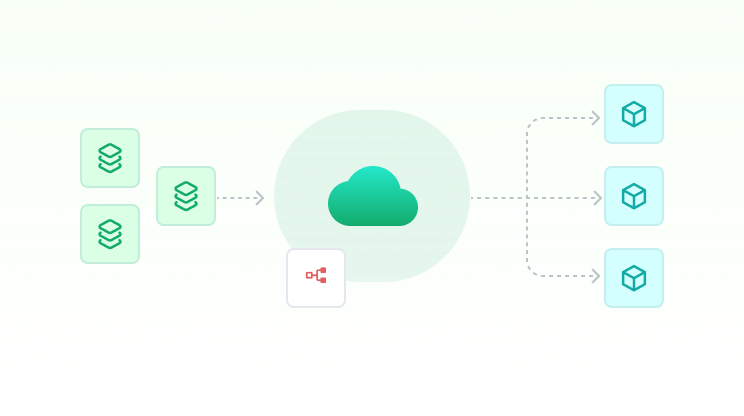
Custom Data Feed
Best for
Analytics at scale & joining Draup with internal data
- Highly customizable feeds for workflow needs
- Scheduled pushes to data lakes/warehouses (S3, ADLS, BigQuery, SFTP)
- Scalable use cases with the data
- Integrates with internal data assets for co-pilots/agents
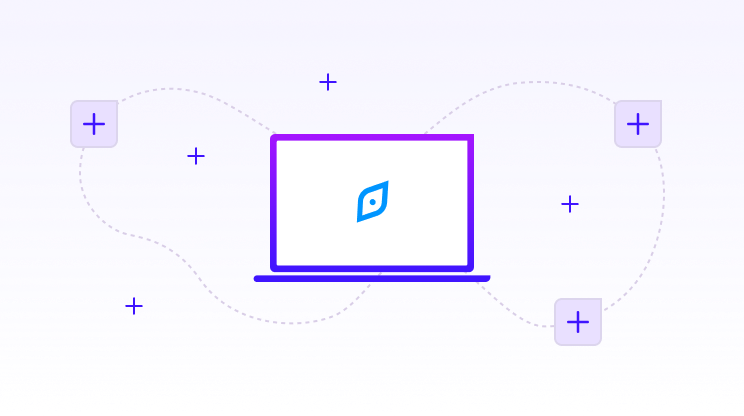
Draup Platform
Best for
Fastest time-to-value,
no build required
- Ready-to-use UI with 200+ productized use cases & workflows
- Leverage visualizations & workflows to drive seller action with no overhead
- Enterprise controls: SSO, RBAC, governance
- Integrates UI & functionality into CRM apps
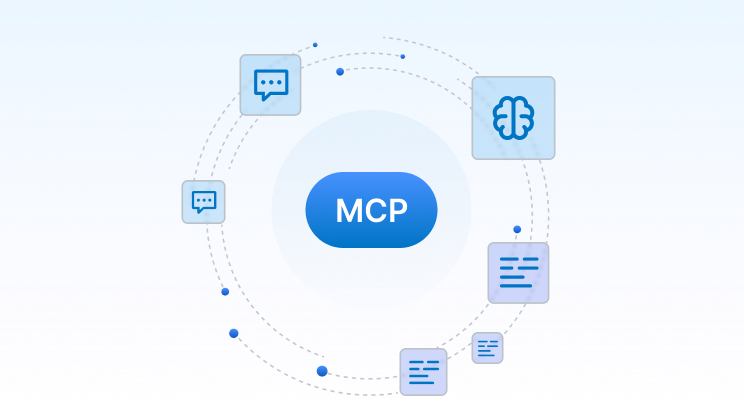
Model Context Protocol
Best for
Real-time Al workflows & LLM applications
- Native integration with Claude, OpenAl, and MCP-compatible Al tools
- Zero ETL, models query live data without pipelines or reindexing
- Governed access with token-based scopes, Pll masking, and audit trails
- Grounded, real-time data prevents LLMs from generating outdated or inaccurate insight

Frequently Asked Questions
What exactly is Account Prioritization?

A signal-driven ranking of target accounts, combining Industry, Account, and Buyer intelligence (Business Intentions, stack changes, financials, geo footprint, outsourcing, committee maps) to show where to focus now.
How are accounts scored?
Three pillars: Fit (ICP, firmographics, footprint, industry drivers), Intent (Business Intentions, started/stopped tech, outsourcing, announcements), and Timing/Reachability (exec moves, renewals, buyer-org coverage). Each pillar is weighted and explainable.
Can we customize the scoring model?
Yes. Adjust weights, thresholds, decay windows, and tie-breakers by region, segment, product, and motion (net-new vs. expansion).
Where do the signals come from?
Multi-source, corroborated data across public, partner, and licensed sources; normalized and quality-checked before it hits sales.
How fresh are the rankings?
Continuously refreshed with alerts for new signals (stack change, exec move, renewal, center setup, M&A). Recency decay keeps old signals from inflating scores.
Is it explainable to reps?
Every prioritized account comes with a reason code: which signals fired, when, and suggested talk tracks (use cases + relevant products/solutions).
How does this differ from generic intent data?
Generic intent infers web interest. Draup ties objective, account-level signals (earnings priorities, stack churn, outsourcing, governance) to why now and who decides.
Will it help with territory design and routing?
Yes. Create Top-N lists per territory, auto-route by thresholds/capacity, and prevent collisions with account-level locks and audit trails.
How does it integrate with our stack?
Native connections and exports to CRM/ABM; push scores, reason codes, owners, and next best actions into workflows, sequences, and dashboards.
Can we prioritize named accounts and discover whitespace?
Yes. Rank named accounts and surface look-alike/adjacent accounts where industry and stack signals mirror your winners.
Does it support geo and practice decisions (services teams)?
Yes. Use R&D maps, globalization indices, outsourcing footprints to focus regions, staff correctly, and time approach.
How do we reduce noise and false positives?
Use confidence thresholds, multi-signal corroboration, and decay; filter by minimum buyer-org coverage to ensure reachability.
What does rollout look like?
Week 1: connect data + push Top-50 per region.
Weeks 2–4: tune weights, enable playbooks, set alerting and routing.
Quarterly: review KPI lift, adjust thresholds.
Which KPIs should move?
Win rate, ACV, sales cycle, meeting→opportunity conversion, pipeline coverage/quality, expansion/renewal revenue, forecast accuracy, cost-to-sell (less research time).
How do we measure ROI?
Before/after on meeting set rate, M→O conversion, stage velocity, slip rate, late-stage losses, plus rep time saved on research.
Is it GDPR-aligned and enterprise-ready?
Yes. GDPR-aligned, role-based access, SSO, auditability, and configurable field exposure by team/region.
Can we bring our own signals?
Yes. Ingest first-party product usage, win/loss, campaign engagement, partner telemetry; map them into the scoring model.
What about pricing and pilots?
Pricing is based on seats and coverage. We support focused pilots with success criteria tied to the KPIs above.


.svg)


.svg)