


AI Agent for Financial Opportunity Intelligence
Follow the Spend, Not Just the Org Chart
The AI sales agent that reads every financial signal at a target account, benchmarks it against named peers, and tells you which service plays the numbers actually support. Stop pitching into accounts with no budget cycle. Start every pursuit with the financial proof on your side.
By filling up this form, you agree to allow Draup to share this data with our affiliates, subsidiaries and third parties
Your Team Is Selling Into Accounts Without Understanding the Financial Reality

No Tier Designation
Sellers treat all large accounts as equal pursuits. Without a Tier 1 vs. Tier 3 designation backed by financial evidence, pursuit resources are spread across accounts with very different budget cycle states and investment intent.

Disconnected Financial Data
Revenue growth, IT spend elasticity, R&D intensity, and peer benchmarks exist in separate sources. Without a synthesized view, sellers cannot connect the financial picture to a specific service play or opening narrative.

Missed Budget Windows
New leadership appointments, CapEx announcements, and workforce restructurings signal the opening of vendor relationship windows. Teams that do not track these signals miss the highest-probability engagement moments.

Generic Conversation Openers
Sellers walk into financial discussions with market statistics that could apply to any company. A conversation grounded in the account's own revenue per employee gap versus a named peer is far more likely to open a deal.


How This AI Sales Agent Works
The Financial Opportunity Intelligence Agent synthesizes three years of financial performance, a full peer KPI benchmark, a signal linkage analysis, and a priority-to-service-play mapping into a single CRO-grade brief. The output moves directly from raw financial data to a tier designation and ready-to-use conversation narratives.

Three years of revenue, EBITDA, IT spend, and R&D spend are pulled and structured into a single financial snapshot with YoY delta and 3-year CAGR. An FY+1 forecast is generated with implied growth rates and a credibility assessment comparing forecast assumptions against the historical CAGR.
What is Amazon's three-year revenue CAGR, and how does the FY2026 revenue forecast compare to that trajectory?

Revenue is broken down by business unit and geography with YoY growth rates and share percentages. IT and R&D spend are normalized per employee and as a percentage of revenue. IT spend elasticity is calculated relative to the revenue CAGR to identify whether technology investment is growing faster or slower than the top line.
Is Amazon's IT spend growing in lockstep with revenue, or is it accelerating ahead of the top line?
All financial metrics are benchmarked against a defined peer group with leader, middle, and laggard designations per metric. The one-line peer read distills the benchmarking into the single most important insight for a seller to carry into a conversation.
Where does Amazon rank in IT spend intensity relative to Microsoft, Google, Meta, Apple, and Alibaba?

Each major financial movement is connected to the underlying cause and the specific implication for a seller. This translates raw data points into conversation-ready narratives: what the data shows, why it is happening, and what it means for a service provider engaging the account right now.
What does Amazon's 22.6% R&D spend growth actually signal for an AI platform engineering seller?
.svg)
Each of the account's strategic priorities is matched to a financial signal, a recommended service play, and a named executive entry point. This connects the financial intelligence directly to actionable pursuit plays with specific buyers attached.
Which Amazon executive owns the agentic AI deployment priority and what is the financial hook for that conversation?

The most timely entry-point signals are identified and dated; each with a specific explanation of why it opens a vendor relationship window right now. This gives sellers the outreach trigger and the rationale in a single structured table.
Which recent Amazon signals represent the highest-probability windows for a seller to establish a new relationship in Q2 FY2026?
.svg)
A solo financial health rating assesses the account's own trajectory. A relative financial health rating benchmarks it against peers by rank and vs. industry average. Risk flags are identified with seller implications. The final output is a Tier 1, 2, or 3 designation with the evidence and timing rationale that supports acting now.
Is Amazon a Tier 1 pursuit right now, and what is the financial evidence that justifies the engagement window?


Financial Opportunity Intelligence Agent is used by
1
Enterprise Account Executives
Walk into every account conversation with a CRO-grade financial brief: opportunity tier, financial health rating, budget cycle timing, and the specific executive to call first.
2
Revenue Operations
Prioritize pipeline based on verified financial capacity, investment intent, and active budget cycle status rather than account size or relationship history alone.
3
CROs and Sales Leaders
Receive a Tier 1 or Tier 2 account designation backed by financial evidence: IT spend trajectory, R&D growth, peer benchmarks, and engagement window timing.
4
Deal Pursuit and Bid Teams
Ground RFP responses and executive briefings in verified financial data: three-year revenue trajectory, EBITDA margin position, IT spend elasticity, and peer rank across every key metric.
5
ABM and Demand Gen Teams
Build financially grounded campaigns targeting accounts in active budget cycles with confirmed IT and R&D spend growth above the peer average.
6
Strategic Account Managers
Use the signal linkage table to connect the account's financial movements to specific service plays and named executives; converting financial intelligence into pipeline.
Accelerate Every Deal Cycle with AI Agents for Sales
Give your teams always-on agentic intelligence that speeds up every step of your GTM motion; from account identification to deal closure.
By filling up this form, you agree to allow Draup to share this data with our affiliates, subsidiaries and third parties


Unlock a complete Financial Opportunity Intelligence package for any target account

CRO Briefing Card
Opportunity tier (Tier 1, 2, or 3), financial health rating, one-line account summary, and the three reasons to act now; designed for executive consumption in under two minutes.

Recommended First Engagement
Best-fit workload, executive to engage with name and title, financial hook, tech already deployed, and timing window; all in a single structured table.

Financial Dashboard
Three-year revenue, EBITDA, IT spend, and R&D spend with YoY delta and CAGR; plus FY+1 forecast with implied growth rates and credibility assessment.

Revenue Mix Analysis
Revenue breakdown by business unit and by region with YoY growth, share, and a strategic narrative on where the growth lives and what it means for a seller.

Efficiency Ratios
IT and R&D spend per employee and as a percentage of revenue; IT spend elasticity vs. revenue CAGR; all benchmarked against peer average.

Signal Linkage Table
Each major financial data point connected to why it is happening and what it means for a seller; translating raw numbers into conversation-ready narratives.
Full Peer KPI Comparison
Side-by-side comparison across all key metrics with peer ranks and industry average; plus leader, middle, and laggard designations per metric.

Opening Narratives
Three ready-to-use conversation openers tailored to different buyer personas (engineering leader, CFO or COO, CEO); each grounded in specific financial data points from the report.

Signal Hooks
A dated table of the most timely entry-point signals; each with the specific reason why it opens a door right now for a seller.

Financial Health Verdict
Solo financial health rating with dimension-by-dimension assessment; relative financial health rating with peer rank and vs. industry average; and a full risk flag list with implications for the seller.

Opportunity Tier Designation
Final Tier 1, 2, or 3 designation with the evidence and timing rationale that justifies acting now rather than later.
Impactful insights, delivered real-time
Access insights via API, custom data feeds, the Draup platform or using MCP
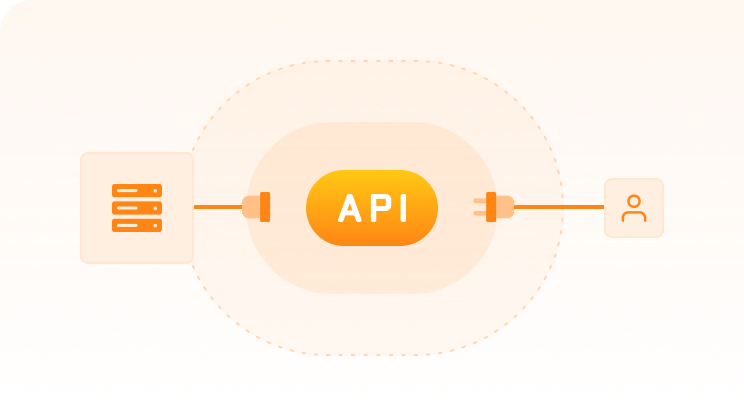
APIs & Integrations
Best for
Embedding live insights in workflows without storing data
- Native integrations with 33+ CRMs, like Salesforce, Hubspot, Microsoft Dynamics CRM, etc.
- Real-time access to critical data
- Enhanced security and data Integrity
- Efficient API performance with flexible limits
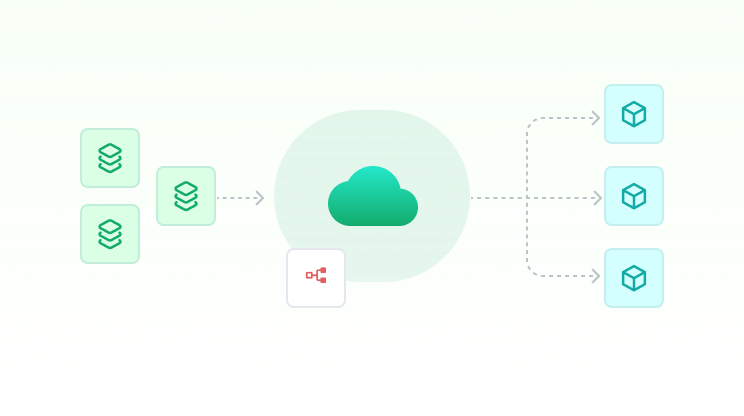
Custom Data Feed
Best for
Analytics at scale & joining Draup with internal data
- Highly customizable feeds for workflow needs
- Scheduled pushes to data lakes/warehouses (S3, ADLS, BigQuery, SFTP)
- Scalable use cases with the data
- Integrates with internal data assets for co-pilots/agents

Draup Platform
Best for
Fastest time-to-value,
no build required
- Ready-to-use UI with 200+ productized use cases & workflows
- Leverage visualizations & workflows to drive seller action with no overhead
- Enterprise controls: SSO, RBAC, governance
- Integrates UI & functionality into CRM apps
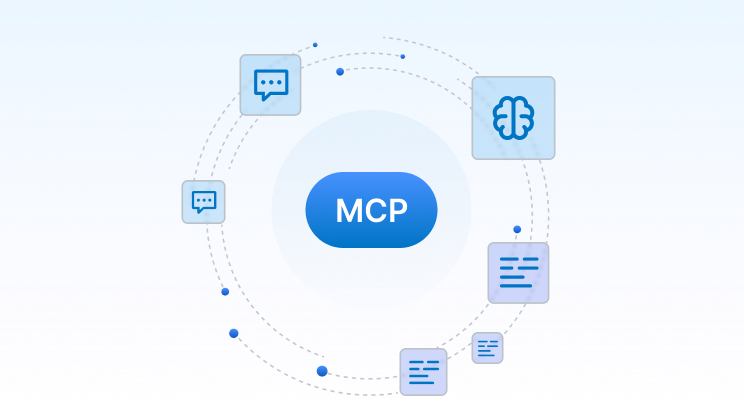
Model Context Protocol
Best for
Real-time Al workflows & LLM applications
- Native integration with Claude, OpenAl, and MCP-compatible Al tools
- Zero ETL, models query live data without pipelines or reindexing
- Governed access with token-based scopes, Pll masking, and audit trails
- Grounded, real-time data prevents LLMs from generating outdated or inaccurate insight
Accelerate Every Deal Cycle with AI Agents for Sales
Give your teams always-on agentic intelligence that speeds up every step of your GTM motion; from account identification to deal closure.


The Financial Opportunity Intelligence Agent is Powered by unparalleled global market data


.svg)

.svg)
.svg)


.svg)


.svg)