
Using Talent Intelligence to Understand How Peers Are Structured
How a global specialty insurer used Draup to build a structured, data-backed view of a peer's organizational design across business functions and risk leadership.
~3500
Employees
~$4B
Revenue
Specialty Insurance & Reinsurance
Industry
Stamford, Connecticut
Headquarters
About the organization
The organization is a global specialty insurance and reinsurance enterprise operating across more than 200 countries and territories. With a portfolio spanning property, casualty, financial lines, and specialty risks, it serves multinational corporations, mid-market businesses, and public sector entities. Its scale and geographic reach require sophisticated organizational architecture, balancing centralized governance with regional execution across every major business function.
The Core Challenges
Business Function Coverage Mapping
The organization sought a structured, function-by-function view of how a key competitor deployed its technology and digital capabilities across regions. This included understanding which functions operated globally, and which were concentrated in regional hubs.
Regional Governance Visibility
Understanding the regional distribution of specialist engineering, automation, and process functions, along with the governance model behind their placement, was essential for benchmarking the organization's own regional operating design.
Risk Function Hierarchy Intelligence
The organization needed a comprehensive view of a competitor's Risk Management organizational structure. This spanned hierarchical layers, sub-functional breakdown, and how quantitative risk capabilities were distributed relative to governance and compliance roles.
Leadership Movement Tracking
Tracking executive movement across a competitor's risk of leadership over the prior 12 to 24 months, covering key hires, promotions, and departures, was needed to surface signals about strategic priorities and organizational direction.
The Solution
Data Analyst

PROFILE
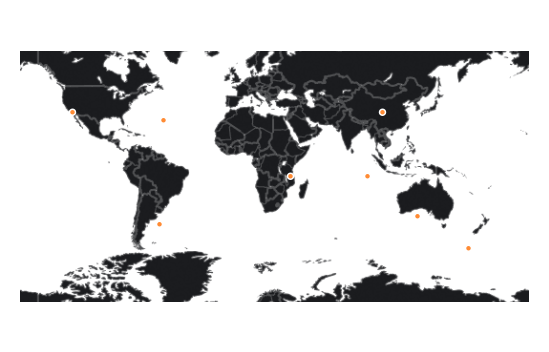
LOCATION ANALYSIS
TALENT MARKET INSIGHTS

CAREER PATHS
DATA INTEGRATION
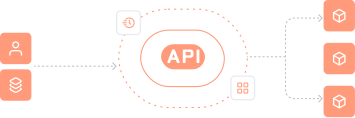
TECH STACK

The image is for representational purpose only.
01
Function × Region Matrix
Draup mapped 16 distinct business functions, including IT Operations, Data Analytics, Cybersecurity, and Process Engineering, against a four-region matrix (NAM, LATAM, APAC, EMEA), identifying which functions operated as fully global capabilities and which were structured as regional centers of excellence.
02
Leadership & Hierarchy Mapping
For each function, Draup surfaced the reporting lines, role seniority distribution, and named leadership, from C-suite executives down to senior individual contributors, providing a structured, profile-level view of how each function was governed and staffed across regions.
03
Risk Org Structure Analysis
The Risk Management function was mapped across its full hierarchy, covering Actuarial Risk, Catastrophe Risk, Financial Risk, Risk Operations, Portfolio Governance, Risk Capital Modeling, and Compliance, with workforce composition analyzed across seniority layers for each sub-function.
04
Executive Movement Intelligence
Key executive movements across the competitor's risk leadership over the prior 12 to 24 months were tracked and structured, covering targeted external hires into global roles, internal promotions, and departures, enabling the organization to read the strategic direction of its competitor's risk capability.
Outcome
6,100+
Locations
4M+
Career Paths
1.7M+
Peer Group Companies
28K+
Skills
3,500+
Roles
1B+
Professionals
55K+
Universities
1B+
Job Descriptions
200K+
Courses
180K+
Technology Solutions
1.6M+
Account Priorities
Labor Market Data Contextualized with Business Intelligence for Every Decision
Analyzing 1B+ data points daily from 100K+ sources
6,100+
Locations
4M+
Career Paths
1.7M+
Peer Group Companies
28K+
Skills
3,500+
Roles
1B+
Professionals
55K+
Universities
1B+
Job Descriptions
200K+
Courses
180K+
Technology Solutions
1.6M+
Account Priorities

.svg)




.svg)
