
Extracting Company Priorities at Scale: Inside Draup's Self-Hosted AI Pipeline
.svg)
Companies reveal their plans in pieces: a deal in the news, a target on an earnings call, a restructuring on page 60 of an annual report. This post describes the pipeline that turns those pieces into one evidence-backed priority list per company, and why it runs on a 4B-parameter open model on a single GPU instead of a commercial API.
What Counts as a Company Priority
A strategic priority is an initiative a company has committed money, people or leadership attention to, with a stated outcome: integrating an acquisition, building a plant, migrating to a new cloud platform, cutting $500M of cost. A new logo or an unchanged dividend does not count. Priorities matter because they show where budget goes next, which changes what a seller pitches, what a recruiter targets and what a strategist watches.
Every priority Draup produces has the same five parts, so priorities can be compared across companies and over time. Here is an illustrative example:
Why Extracting Company Priorities Is Harder Than Summarizing Documents
Asking a model to "list this company's priorities" produces text that sounds right and fails as a dataset, for four reasons:
- Duplication. Six outlets cover one acquisition, the CFO mentions it on every call, and the annual report covers it in three places. Without merging, one initiative becomes ten records.
- Surface similarity cuts both ways. Two different job-cut announcements can read almost identically, while two write-ups of the same spin-off can share barely a word.
- Most text is not a priority. Risk-factor language, accounting notes, market commentary and retrospectives all sound important and describe no new commitment.
- The sources differ by three orders of magnitude. Hundreds of short articles a month, one transcript a quarter, one filing a year that can exceed 100,000 words, for thousands of companies.
How the Pipeline Reads News, Earnings Calls and Annual Reports
The pipeline has three stages: read each source with a method suited to its length, merge duplicates within the source, then merge across sources into one profile per company. One open 4B model serves every stage from inside Draup's cloud account.
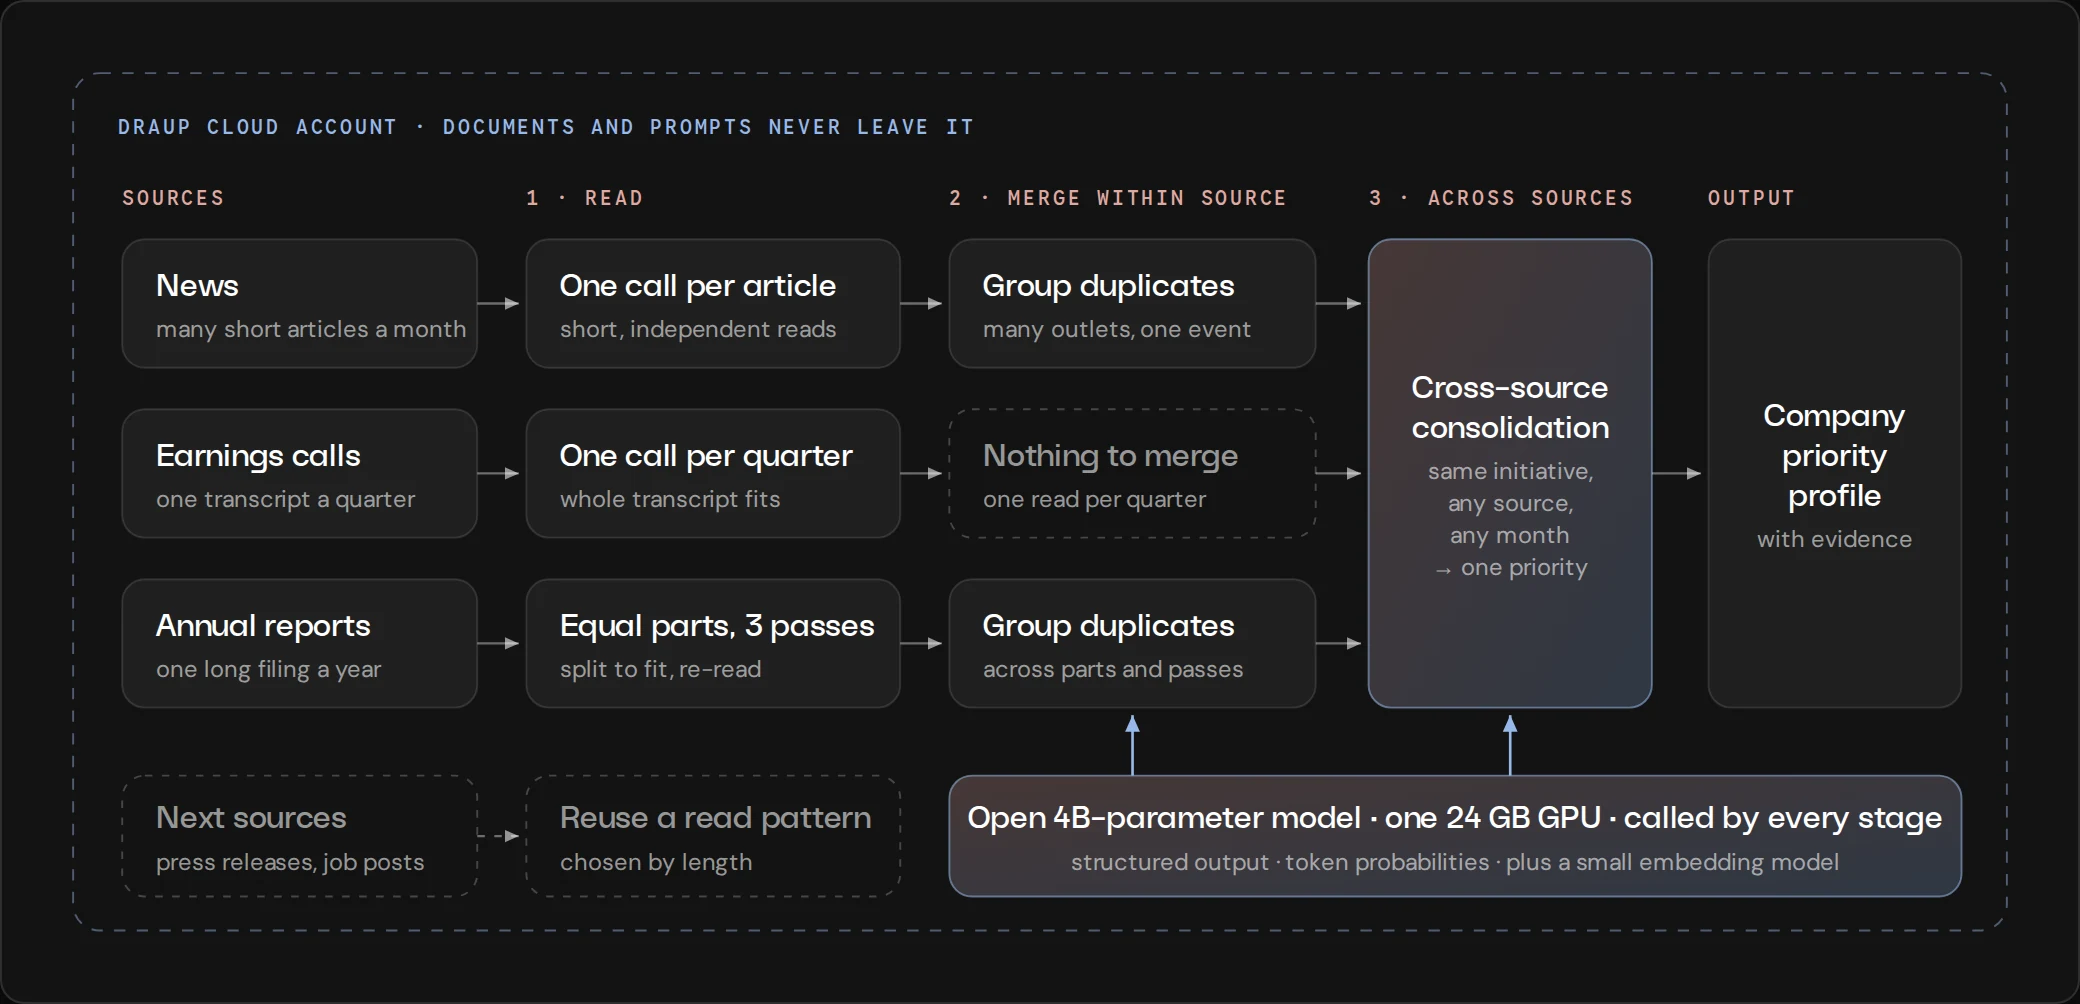
Only the read stage is source-specific. Both merge stages use the same grouping method, and every stage emits one fixed schema, which is what makes a new source cheap to add.
Every read emits the same schema: name, description, expected outcomes, business functions and a deduplication fingerprint (anchor topic, event type from a fixed enum, entities, date, primary figure). Business functions are an enum per industry enforced with constrained decoding, so an invalid value cannot be generated, only a wrong one.
News is one call per article, batched. The instruction prefix is identical for every article about a company, so prefix caching computes it once per company. The publication date is passed in so the model can separate current news from retrospectives.
Earnings calls fit the context window whole, so each quarter is one call with nothing to deduplicate afterward.
Annual reports are split into the fewest equal parts that fit the usable context (about 41,800 tokens after the prompt and a safety margin), with a 1,000-token overlap. Each part is read up to three times; later passes see the priorities already found and are asked only for new ones, which recovered substantially more priorities in our evaluation than a single pass.
Why Embedding Clustering Fails on Company News
Within a source, the same event appears many times. The standard fix is embedding similarity with a cutoff. On company data, any cutoff fails in both directions: in real company news, same-event pairs score as low as 0.27 cosine similarity and different-event pairs as high as 0.95.
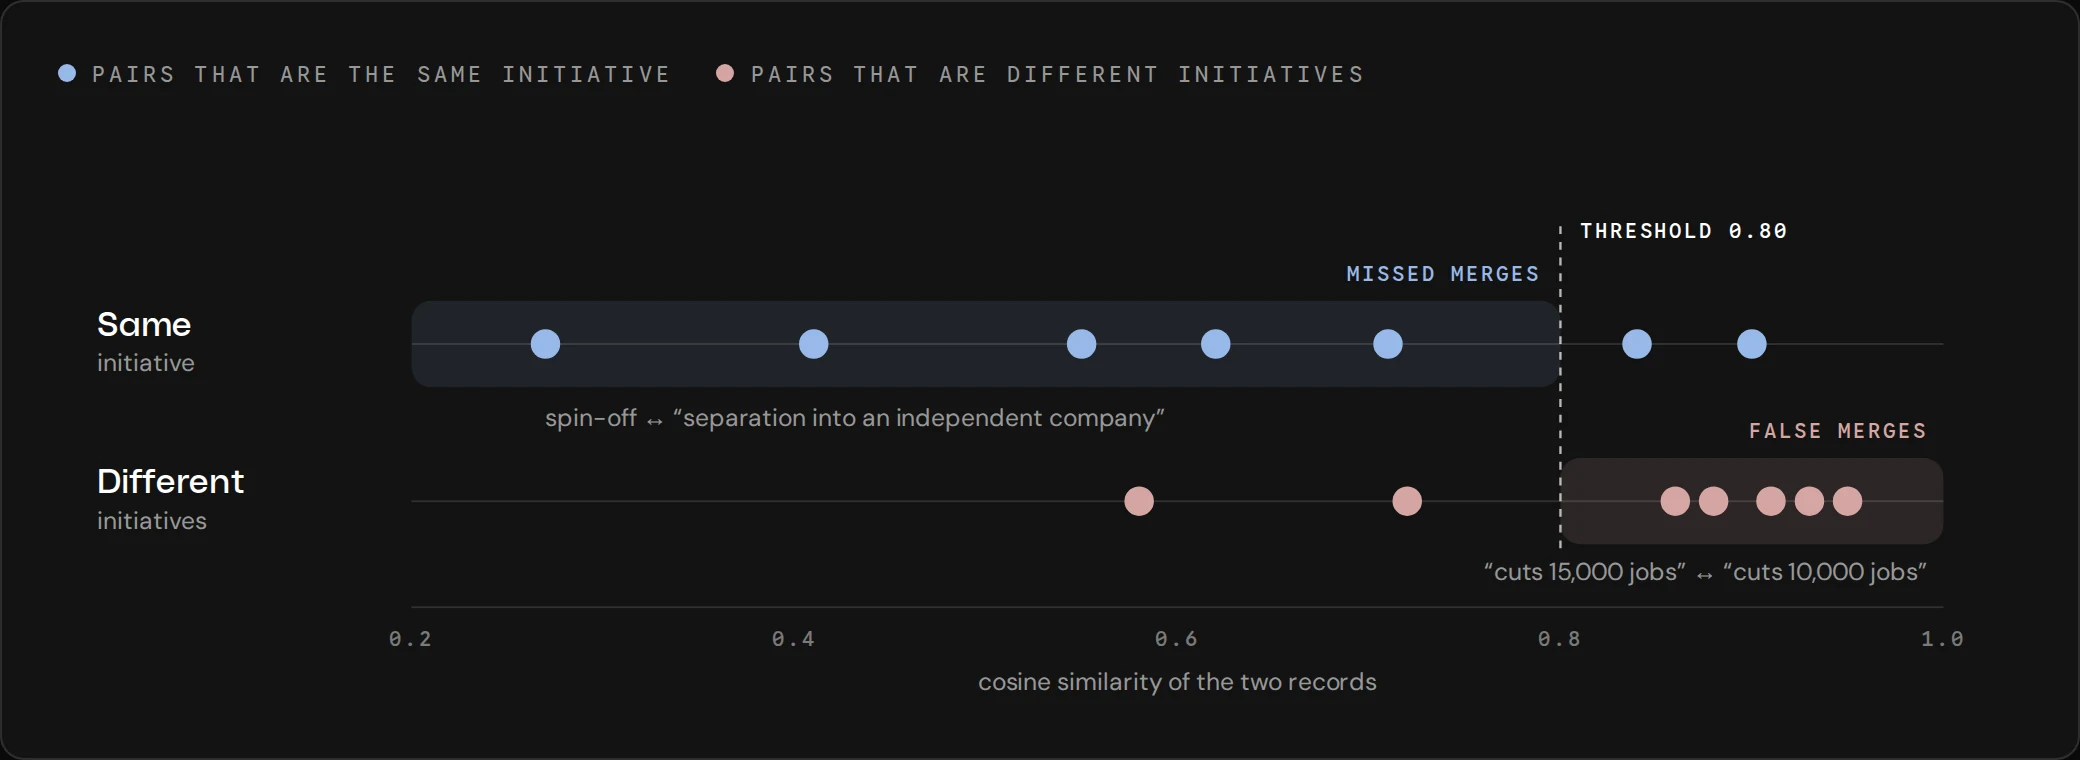
No threshold separates the rows. Scores are illustrative; the pattern matches real company news. Move the threshold left and false merges grow, right and missed merges grow.
Five properties of the data cause this:
- Company news is templated. Two acquisitions or two layoffs share vocabulary and differ only in a name, number or date.
- One event, many registers. A headline, a CFO remark and an audited paragraph describe the same acquisition in different words.
- Everything about one company looks alike. Shared name, industry and jargon push all pairs into a narrow high-similarity band.
- Numbers and dates barely register. "$1.9B" and "$2B" (same deal) look as alike as "$1B" and "$2B" (two deals), yet the figure is often the only discriminator.
- Errors chain. If A is near B and B is near C, all three merge even when A and C are different events.
The chaining case is the one that bites. A company announces 10,000 job cuts in January (A) and 15,000 in September (C), and a general article covers its cost program (B). B sits at 0.87 to A and 0.86 to C, so clustering merges all three into one priority. General coverage like B is common. Moving the cutoff only shifts the error: tighter misses reworded duplicates, looser merges templated look-alikes.
How the Pipeline Decides Whether Two Records Are One Initiative
Embeddings only propose candidates. The decision comes from normalized facts and a model call, in four steps ordered from cheapest to most expensive:
- Propose. Pairs sharing an anchor topic or an entity, or close in embedding space, become candidates. Tuned for recall; most pairs never qualify.
- Veto. Figures are normalized to one unit and event types mapped to the enum. Pairs with a hard contradiction, such as two different amounts in the same unit, are rejected in code.
- Judge. One model call reads both records and answers SAME or DIFFERENT. The prompt lists why true duplicates legitimately differ (another outlet, another source, less detail). P(SAME) is read from the token probability, not from the model's self-reported confidence, which is almost always "high."
- Cluster. Pairs above the threshold merge. A confident DIFFERENT is a cannot-link constraint that no chain overrides, so A and C above can never merge, and the judge places B. Groups supported by one pair must clear a higher threshold, and each group carries a confidence tier from pair agreement.
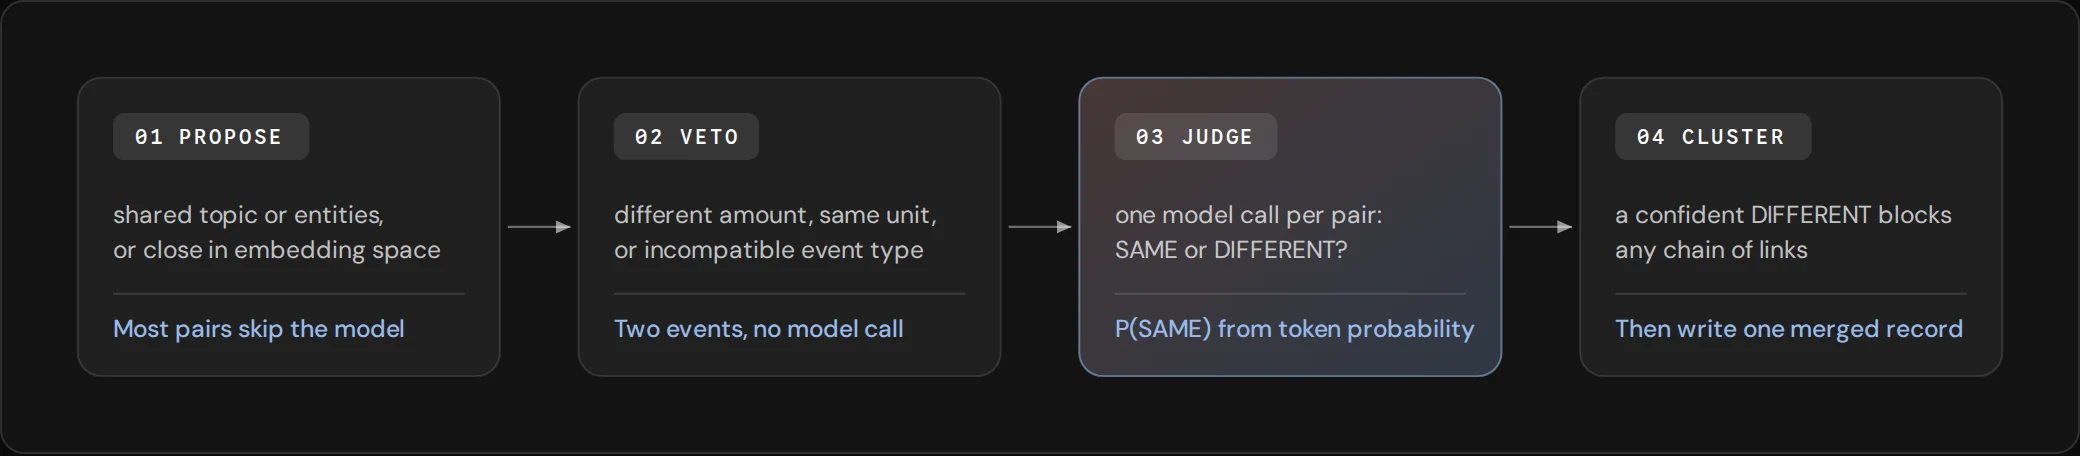
The embedding never decides a merge. The verdict is P(SAME) from the judge's token probability, with a higher bar for groups supported by a single pair.
Each group is then written up fresh from its members. Every fact in the write-up must appear in at least one member, so a figure one outlet reported and another omitted is recovered without invention. Business functions are re-decided for the group rather than unioned, because a union grows with every outlet's stray guess.
How Records From Every Source Become One Priority Profile per Company
After deduplication, each source has a clean list and the same initiative still appears in several of them. The final stage runs the same propose, veto, judge and cluster method across sources and across months, with the source name passed to the judge because a headline and an audited filing describe one initiative in very different registers. The result is one priority with first-seen and last-seen dates, a confidence tier from independent corroboration and links back to every supporting article, call and filing section.
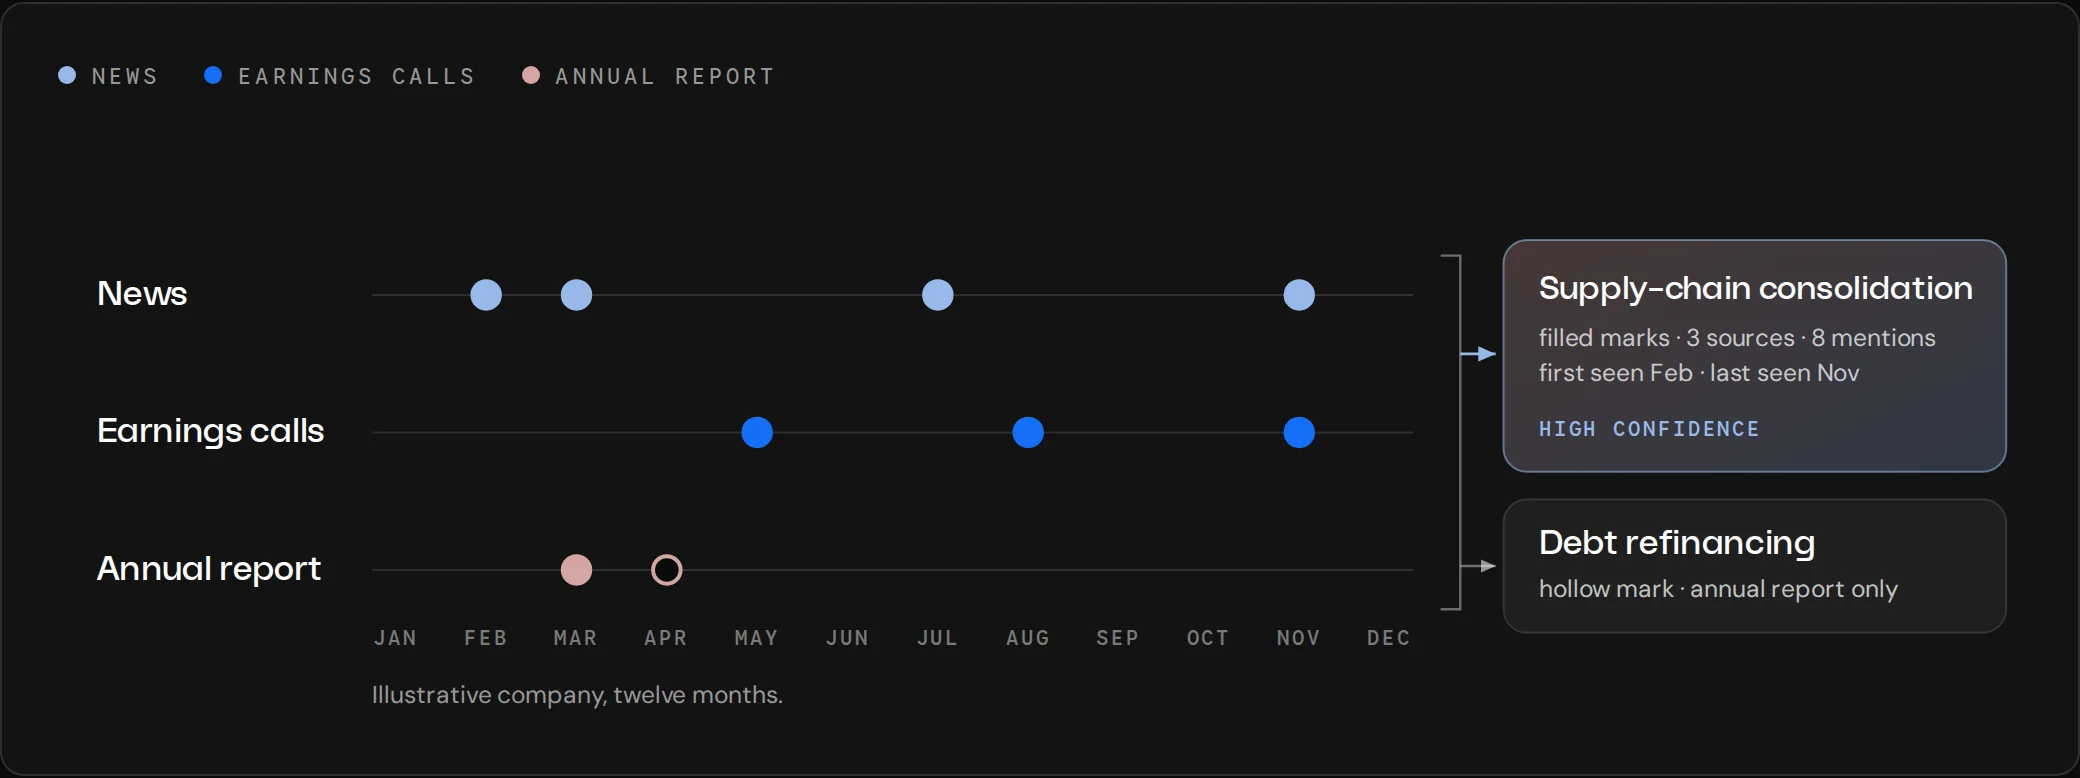
Three sources describe one initiative. Eight mentions over ten months become one priority with first-seen and last-seen dates and three independent sources. The debt refinancing appears only in the annual report and stays its own priority.
Why Draup Self-Hosts the Model, and What the Same Job Costs on an API
The job we priced is one month of news for 73 companies: 3,141 articles read, 5,122 candidate pairs judged and 172 merged priorities written. With prompt caching and batch pricing applied, a mid-tier API does it for $15.94. Our GPU does it for $1.01, about 16 times less. The token counts come from the actual run.
Of the 30.44M input tokens, 24.79M are the repeated instruction prefix. At $2 per million input and $10 per million output, list price is $75.07. Prompt caching bills cached prefix reads at one tenth of the input price (roughly 90% off, after a one-time write at 1.25×), which brings the job to $31.89. Batch pricing halves every token for a 24-hour turnaround, giving $15.94. On our side, the 3,141 extractions took 28 minutes on one 24 GB GPU running the 4B model; the judge and write-up calls are much shorter. Rounded up to one GPU-hour at about $1.01 for an on-demand instance, the job costs $1.01.
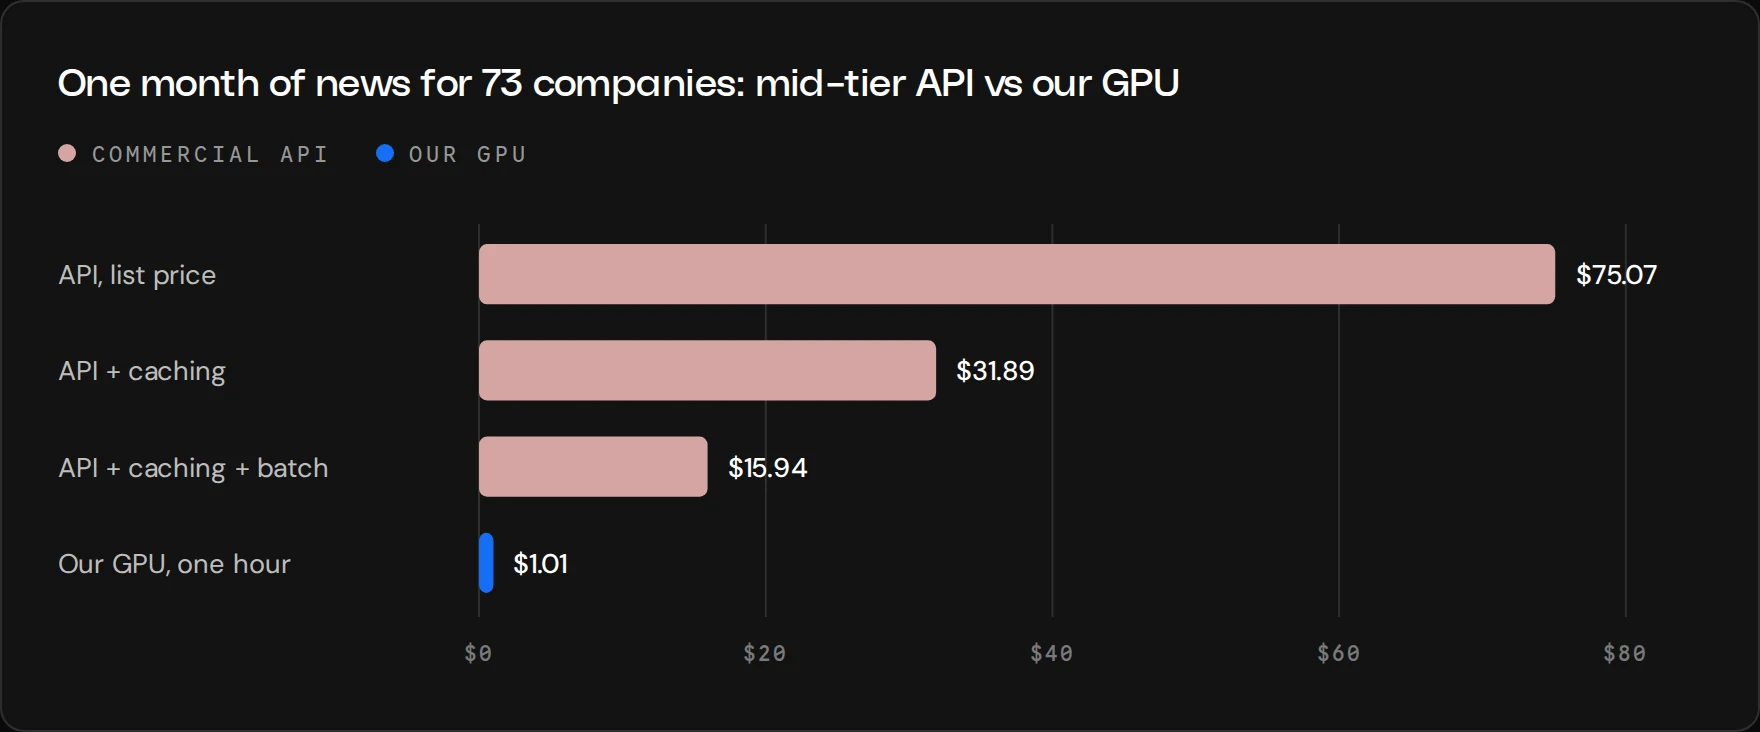
At its cheapest, the API costs about 16 times more. Each API bar adds one discount; the last bar is the fairest comparison.
At 10,000 companies a month, or 120,000 company-months a year, the discounted API cost is roughly $13,000 a year on a small model, $26,000 on a mid-tier one and $65,000 on a frontier one, against about $1,700 of GPU time. Doubling the GPU figure for idle time and restarts still leaves the API 4 to 20 times more expensive, and every prompt change means re-running the job, which costs another GPU-hour on our side and the full amount again on an API. Budget tiers priced below $1 per million input tokens exist; at those prices the gap narrows, and the case rests on the four reasons below that are not about price.
Cost is one of five reasons we host the model ourselves:
- Data residency. No article, transcript, filing or prompt leaves Draup's cloud account, so the same pipeline can later process sensitive or customer-supplied documents without a new data-sharing review.
- Cost scales with GPU hours, not tokens. Prefix caching makes the repeated instructions nearly free, which is what makes three passes per filing section and a judge call per candidate pair affordable.
- Control over decoding. We read token log-probabilities for the SAME verdict, enforce enums with constrained decoding and get exact token counts from the serving tokenizer. Hosted APIs expose some of this, inconsistently.
- Determinism. Weights are pinned and every response is cached under a hash of prompt and schema, so a re-run of an evaluation reproduces exactly. API models are updated or retired on the vendor's schedule, which breaks before-and-after comparisons.
- The whole stack is tunable. Raising the KV-cache memory allocation on one GPU let far more requests run concurrently and multiplied extraction throughput several times over at identical quality, and LoRA adapters extend the model itself when prompting plateaus.
Where Fine-Tuning and New Sources Come Next
Every source starts on the base model with prompting, schema constraints and the structure above. Fine-tuning adds a second artifact to version, evaluate and serve, so it is reserved for behaviors that prompting cannot fix: spotting the one real initiative in a quiet month, separating similarly named companies, and deciding whether an accounting change is strategic. Early LoRA experiments on these judgment calls were promising, and the limit is data rather than method, since a few thousand analyst-reviewed examples per behavior across many industries are needed. Those examples accumulate from the monthly review the pipeline already requires, and adapters are retrained on a schedule and deployed only when they beat the current model on a fixed, company-held-out evaluation set. Several adapters share one base model on one GPU, so a new task adds no deployment cost.
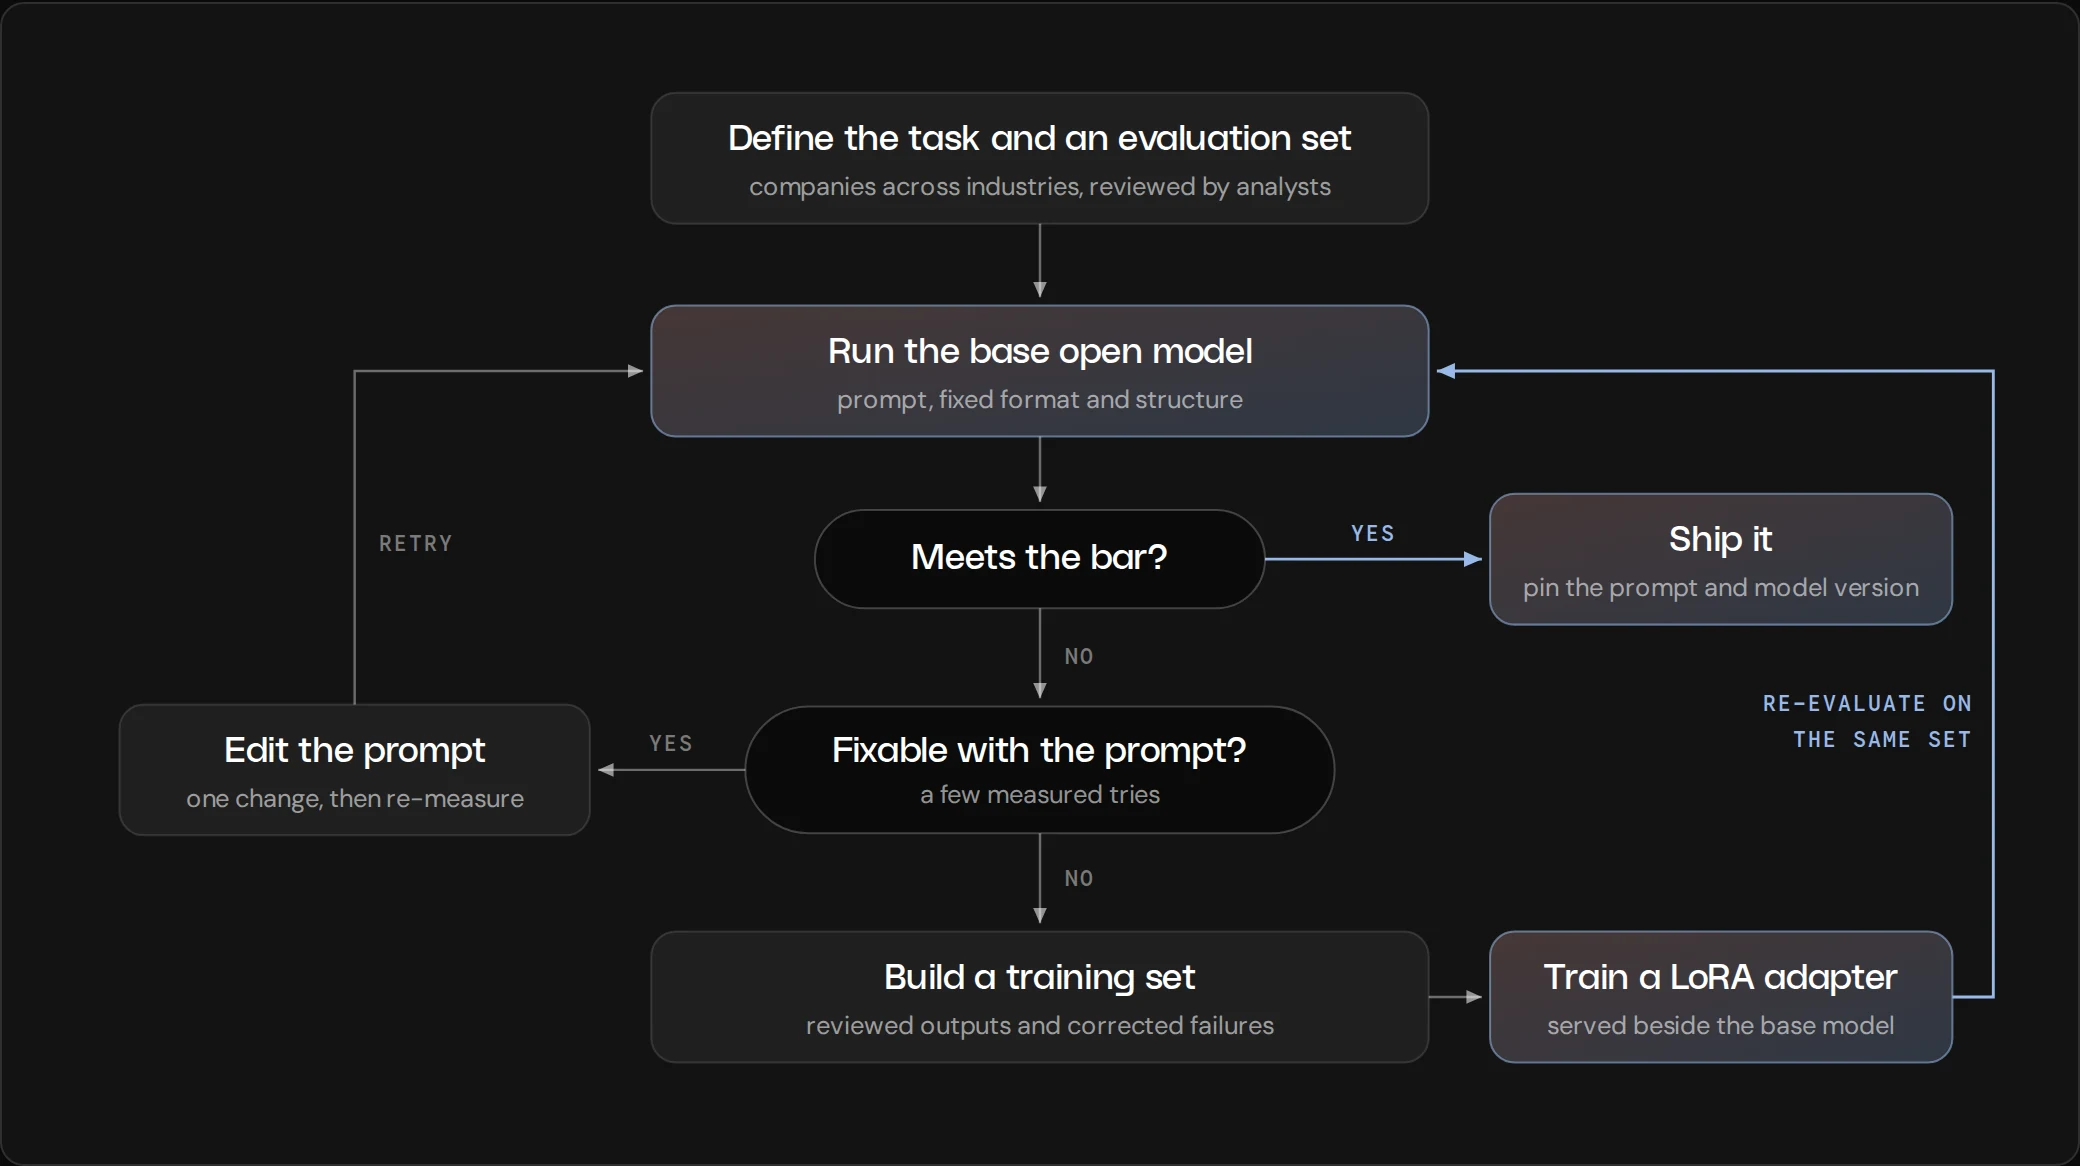
The evaluation set never changes. Base model, every prompt change and every adapter are scored on the same analyst-reviewed companies.
Adding a source means writing three things: the fetch, the read pattern (per document, whole document, or split into parts) and the source description in the prompt. Schema, grouping, consolidation, model and evaluation are reused unchanged. Annual reports went in that way and the grouping stages worked on the first run. Press releases, job postings, quarterly filings and investor-day presentations are next, and most of the work for each is evaluation rather than code.
Three Principles Behind the Pipeline
Principle 1: Give a small model structure
A fixed schema, exact token budgets and repeat passes let a 4B model do work that would otherwise need a much larger one.
Principle 2: Decide matches on facts
Embeddings propose candidates. Normalized facts and a model reading both records decide whether two mentions are one initiative.
Principle 3: Own the stack when volume is high
For repetitive, high-volume extraction, self-hosting keeps data in-house and costs flat, and keeps every layer open to improvement, including the weights.
Company priorities are available in Draup's Sales and Talent Intelligence platforms. Learn more at draup.com.
About the figures. Examples on this page are illustrative. Cost figures estimate inference cost only, based on the stated workload and prices, and exclude engineering, operations, storage and data costs.
Related Articles

.svg)




.svg)
