
AI and Work in 2026
An evidence-grounded intelligence guide combining 34 years of global labor market data with seven Fortune 500 worker portraits.
By filling up this form, you agree to allow Draup to share this data with our affiliates, subsidiaries and third parties


What Was Predicted, What Was Measured, and Why the Gap Matters
AI's impact on work has been forecast far more than it has been measured. Since ChatGPT launched in November 2022, headlines have cycled through displacement anxiety, productivity euphoria, and structural uncertainty, rarely with reference to what is actually measurable in labor markets or at the job level.
This guide approaches the question from two distinct lenses. The macro lens draws on 34 years of World Bank and ILO data across 217 countries, spanning 1991 through 2026. The ground lens draws on seven Draup worker portraits built from Fortune 500 job postings, pay data, and field interviews conducted across 2024 and 2025. Together, they answer the questions CHROs, workforce planning leaders, and talent heads are actually asking.
Analysis is based on Draup's proprietary database of 1B+ global job descriptions, World Bank WDI and ILO ILOEST modelled estimates, and peer-reviewed research from HBS, NBER, MIT Sloan, and Vanguard.
AI and Work in 2026: A Data-Led View
The consensus narrative around AI and jobs has been shaped more by theoretical exposure models than by ground-level observation. Draup's research across Fortune 500 postings, pay data, and 34 years of global unemployment records reveals a fundamentally different picture. Three macro patterns define what is actually happening:
These patterns suggest the labor market is not in structural crisis. It is in structural transition. The distinction matters enormously for how enterprise leaders plan, hire, and invest.
Five Patterns Across the Portraits and the Macro Data
AI Is Taking Tasks Inside Jobs, Not the Jobs Themselves
The Signal:
Across seven Fortune 500 role profiles tracked in 2024 and 2025, AI absorbed the lowest-value work inside each role while the human responsibility set expanded upward. No portrait shows elimination. Every portrait shows transformation.
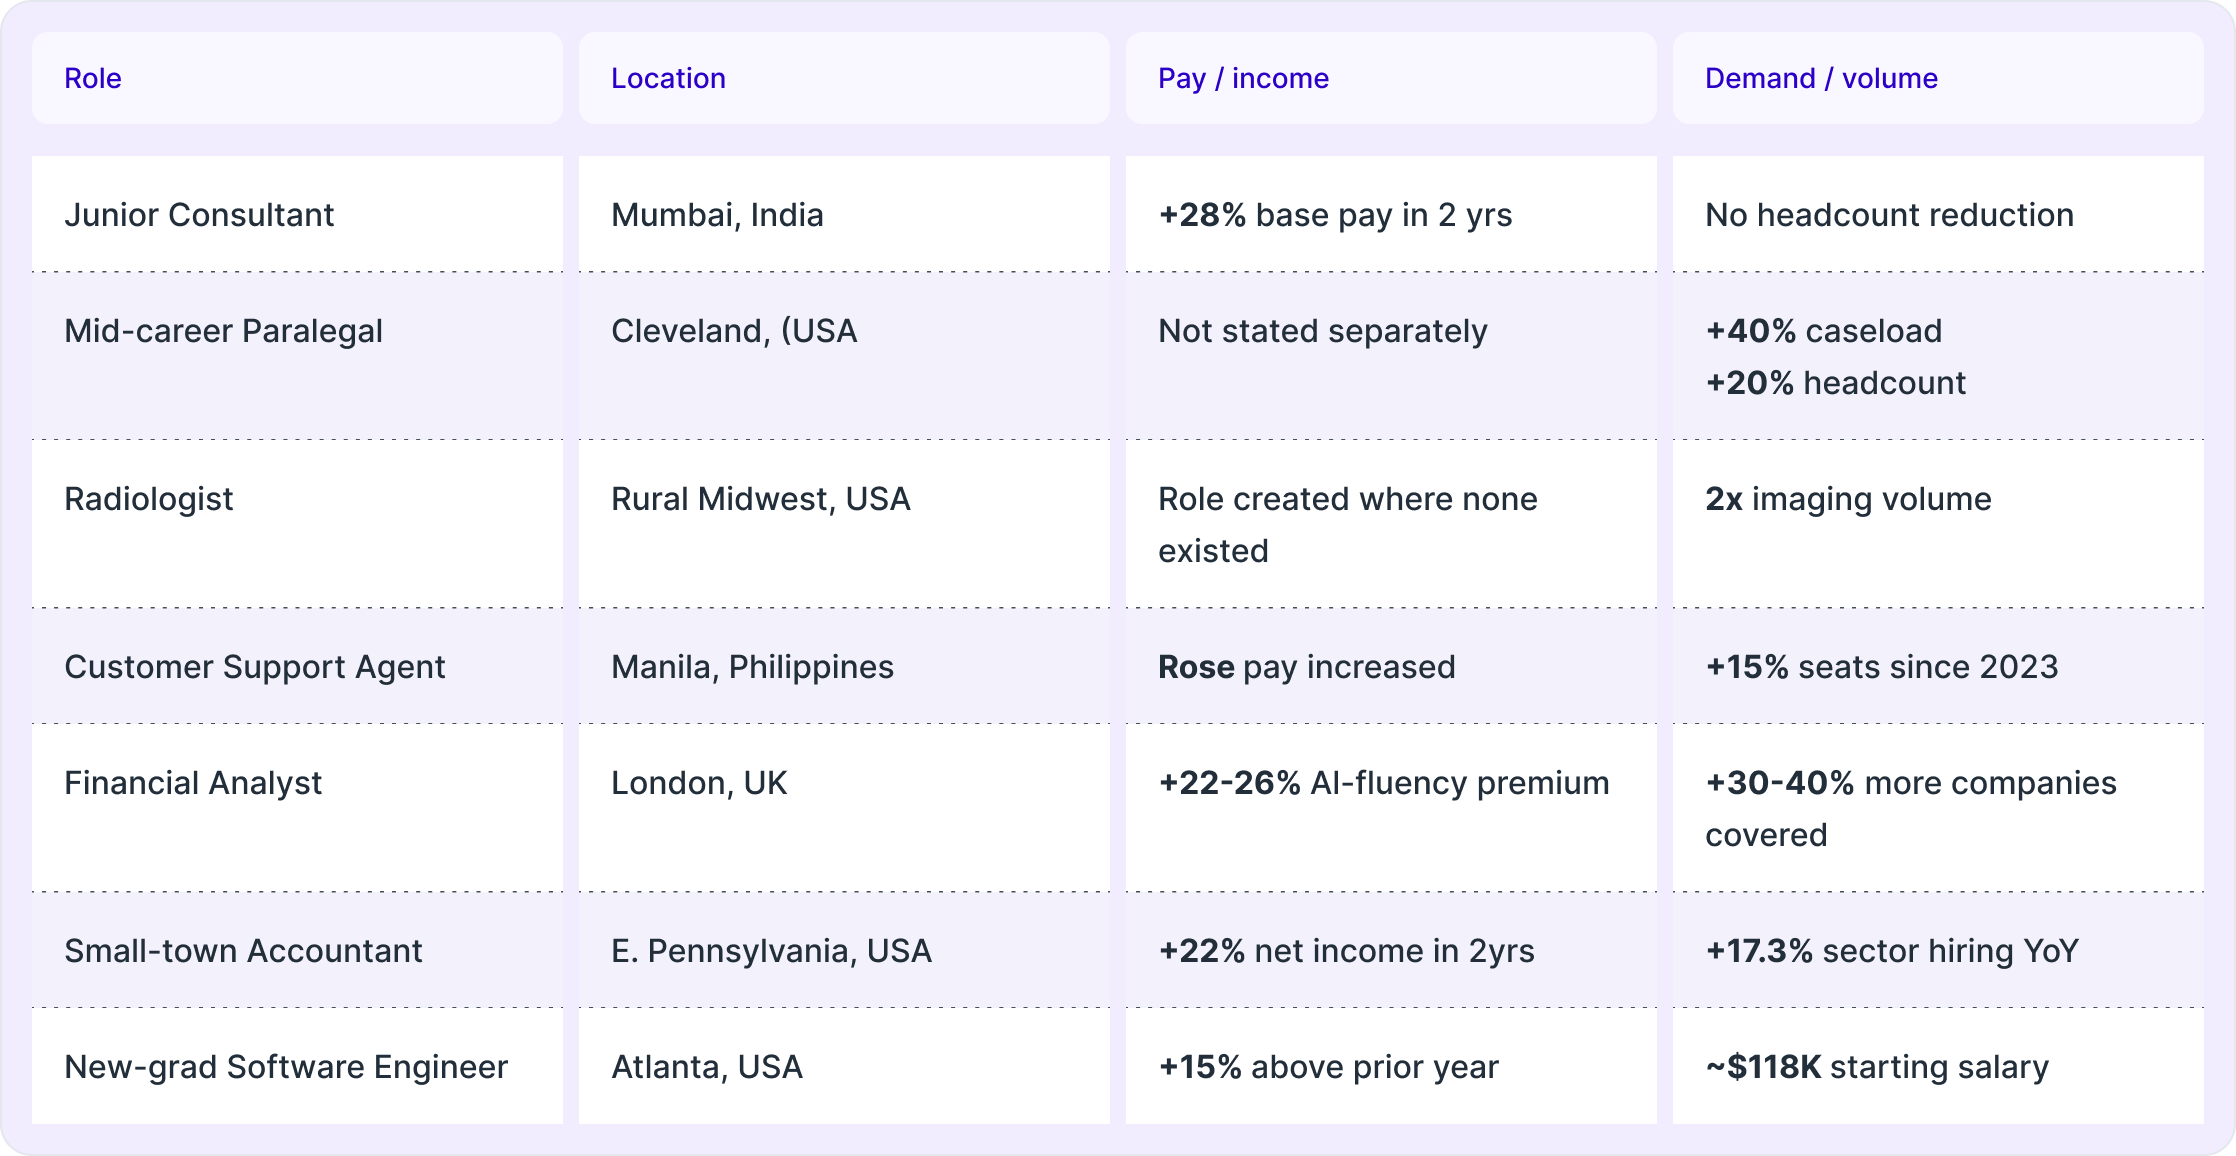
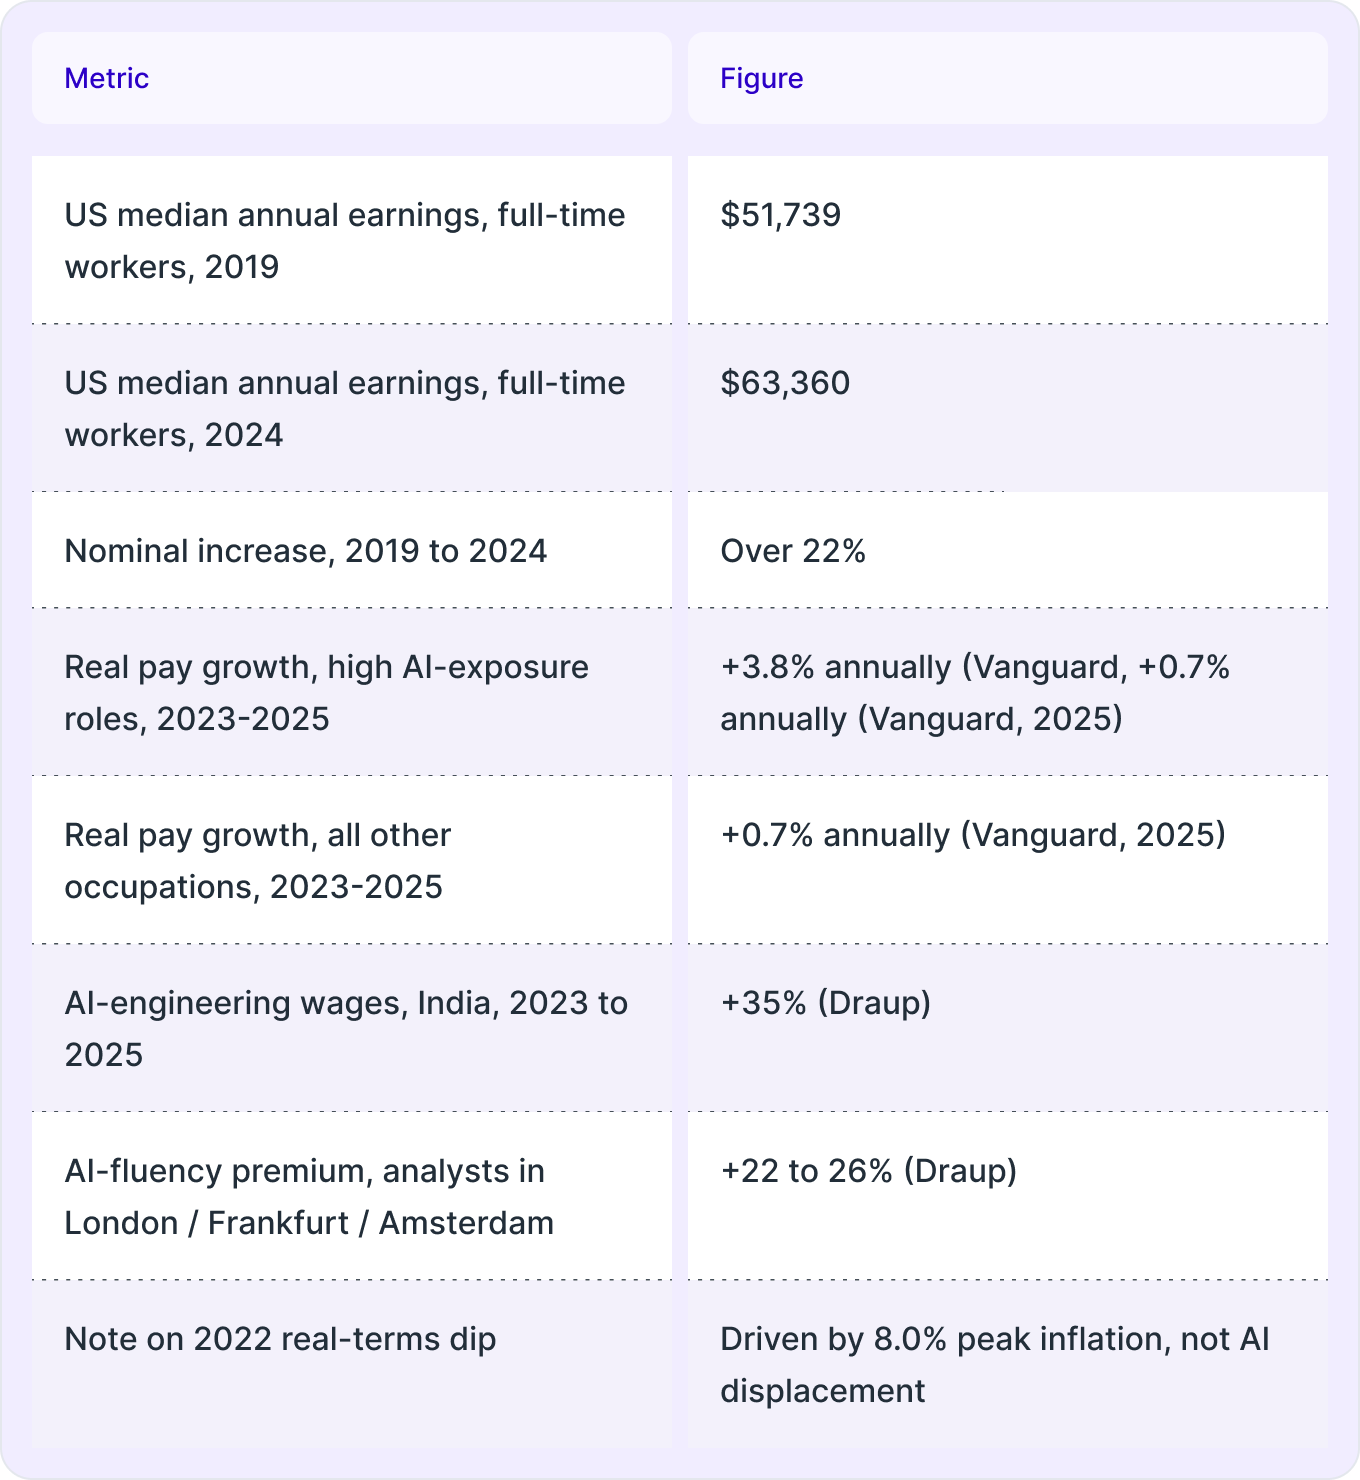
- Junior Consultant, Mumbai: AI handled approximately 60% of analyst tasks by mid-2024, including document review, desk research, first drafts, and baseline models. The firm did not reduce headcount. Analysts two years out started leading projects that previously required a senior manager. Base pay rose 28% in two years. Draup found AI-engineering wages in India rose 35% between 2023 and 2025.
- Mid-Career Paralegal, Cleveland: Caseload is up 40%. Headcount is up 20%. Document review is 3x the 2022 level. AI-assisted review cuts human error 20 to 25%. Risk, Compliance, and Governance postings now list 3.64 additional skills, mostly about working with AI, not being replaced by it.
- Radiologist, Rural Midwest: A critical-access hospital with no on-site radiologist before 2024 now operates with a part-time radiologist two days a week. Imaging volume doubled. Correctly identified abnormalities rose 6 to 26 percentage points with AI in the loop. The role did not disappear. It became possible where it could not exist before.
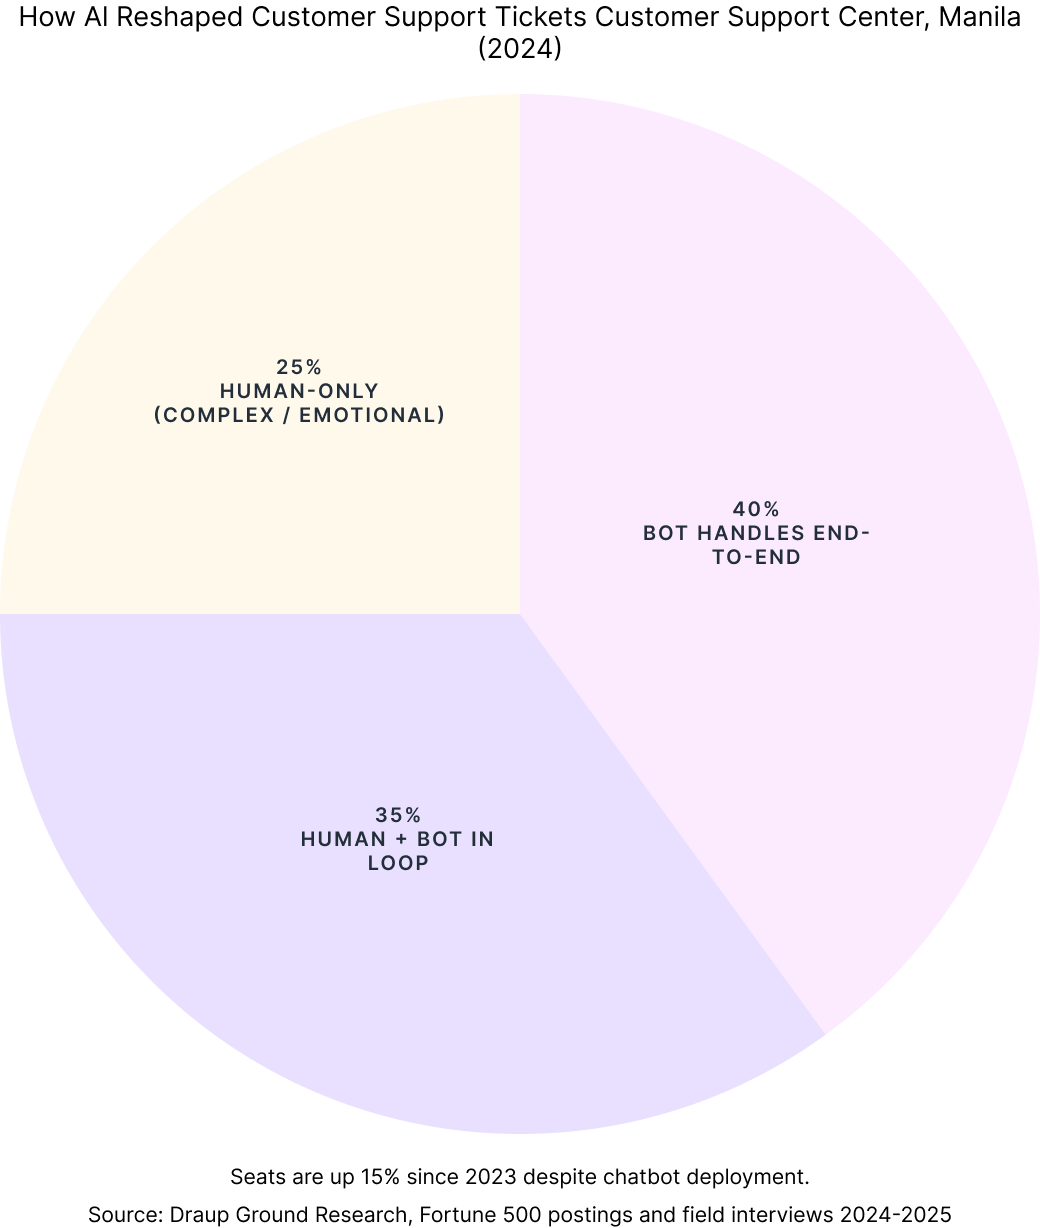
- Customer Support Agent, Manila: A chatbot handles 40% of tickets end-to-end and another 35% with a human in the loop. The remaining 25%, angry, confused, grieving, unusual cases, drive most of retention. Seats are up 15% since 2023. Pay rose. The work shifted toward what the firm calls emotional quality.
- Financial Analyst, London: In 2022, a typical analyst's week was 55% data gathering and 45% analysis. By 2024, AI handles most of the data gathering. Each analyst now covers 30 to 40% more companies. The FCA's 2025 monitoring found no net reduction in qualified analyst roles. AI-fluency premium is 22 to 26% in London, Frankfurt, and Amsterdam.
- Small-Town Accountant, Eastern Pennsylvania: Net income is up 22% in two years, the best stretch of her career. She absorbed clients from a regional firm that closed in 2024. Contract and specialist hiring is up 17.3% year-over-year across the sector.
- New-Graduate Software Engineer, Atlanta: Starting salaries at a Fortune 500 consumer-goods firm are near $118,000, roughly 15% above the prior year. Firms leading AI deployment grew entry-level hiring in 2025 and again in 2026. AI governance and model-risk skills are growing 81% year-over-year.
What It Means:
Draup identifies this as the workload iceberg effect. AI takes the tip: the 2.2% of visible routine tasks that represent only 11.7% of wage value. The human role, judgment, oversight, client relationship, regulatory accountability, keeps the iceberg. The absorbed tasks are the most automatable, not the most valuable.
Strategic Implications:
Productivity Gains Are Converting Into More Demand,
Not Fewer Roles
The Signal:
The standard displacement argument assumes that when AI raises worker productivity, firms reduce headcount to maintain output at lower cost. The evidence from Fortune 500 hiring data does not support this assumption. In every portrait studied, productivity gains converted into expanded output rather than reduced workforce.
Key Data Points:
- The paralegal firm's caseload grew 40% while headcount grew 20%. Productivity went to volume, not layoffs.
- The Manila support center's seat count grew 15% after chatbot deployment. Easy tickets moved to automation; hard tickets moved to humans.
- The financial analyst now covers 30 to 40% more companies with the same headcount. Firm output expanded.
- The accountant absorbed clients from a closed competitor. Her capacity increased through AI tools. She took on more, not fewer, clients. Net income rose 22%.
- WEF projects 78 million net new jobs globally by 2030. The Yale Budget Lab finds no aggregate employment disruption through end of 2025.
What It Means:
Demand for expert services is more elastic than first-order displacement models assume. When AI makes professionals faster, clients do not receive the same amount of work at lower cost. They receive more work, broader coverage, and services they previously could not access. AI relaxes the supply constraint. Demand expands to fill it.
Strategic Implications:
Global Labor Markets Are at a 34-Year Low Despite
Three Years of AI Adoption
The Signal:
Global unemployment hit 4.81% in 2024, the lowest in the World Bank and ILO dataset going back to 1991. The two prior shocks were the 2009 Global Financial Crisis, which peaked at 6.41%, and COVID-19 in 2020, which peaked at 6.59%. Both recovered. The AI era began not at a fragile high but at a 34-year low. The decline did not pause when AI went mainstream in 2022. It accelerated.
Key Data Points:
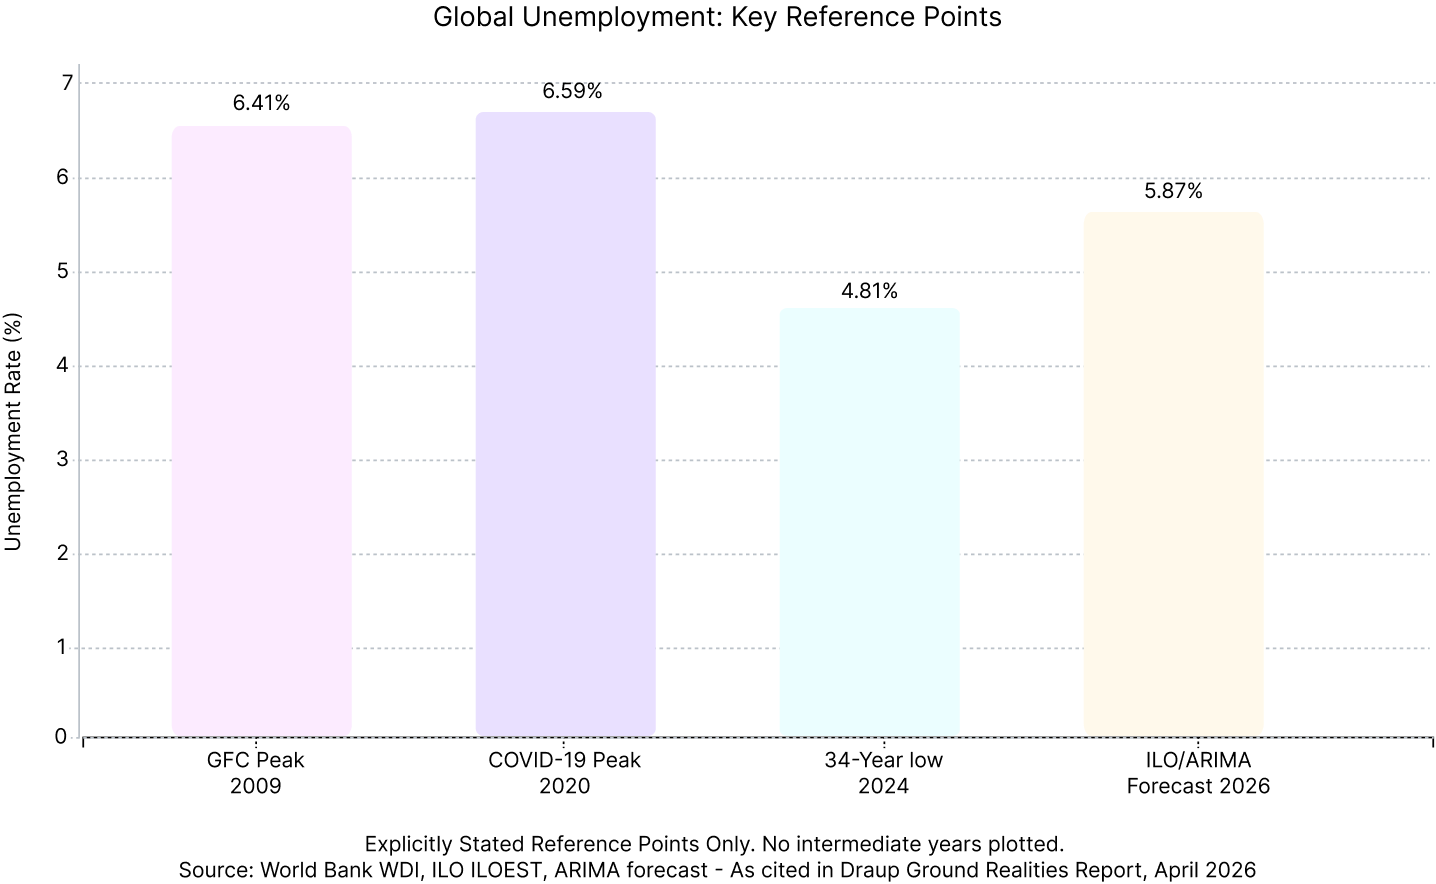
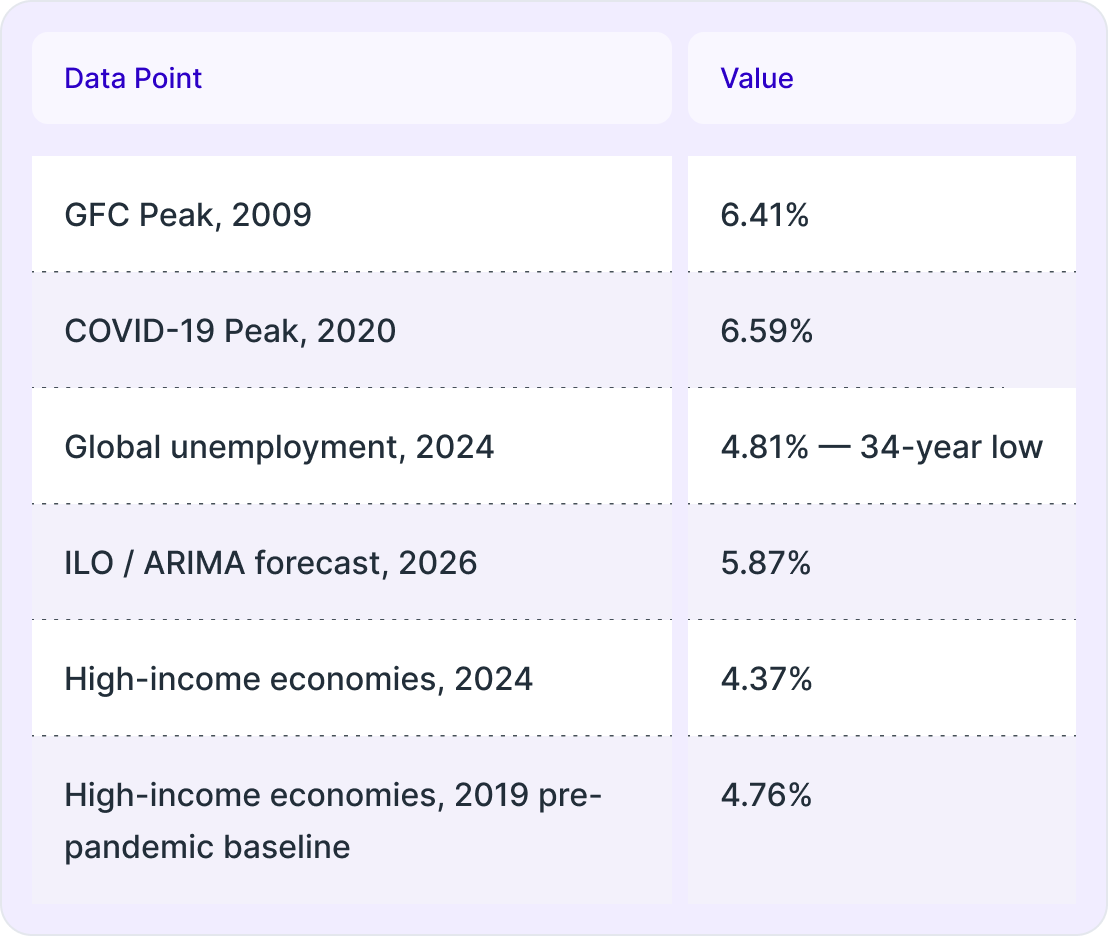

- High-income economies, the most AI-exposed, with large professional services, finance, legal, and technology sectors, averaged 4.37% in 2024, below their 2019 pre-pandemic baseline of 4.76%.
- Not one high-income economy shows a rise in unemployment after November 2022, the month ChatGPT launched.
- Every country above 20% unemployment in 2024 sits in Sub-Saharan Africa. Eswatini: 34.64%. South Africa: 32.28%. Botswana: 23.81%. These figures reflect governance and structural economic conditions that long predate AI.
- MENA has run above 9% for three decades through every technology wave. East Asia has held near 3 to 4% the whole time. AI did not put these lines where they are.
What It Means:
The countries most exposed to AI automation have the tightest labor markets in the dataset. This is the clearest empirical test of AI displacement available over the past three years, and it does not support the claim. The AI risk map in most forecasting models is actually the formality map: higher-income countries show higher measured unemployment because they count informal workers as jobless. That structural measurement difference has nothing to do with AI.
Strategic Implications:
AI-Exposed Workers Are Seeing Faster Wage Growth,
Not Wage Suppression
The Signal:
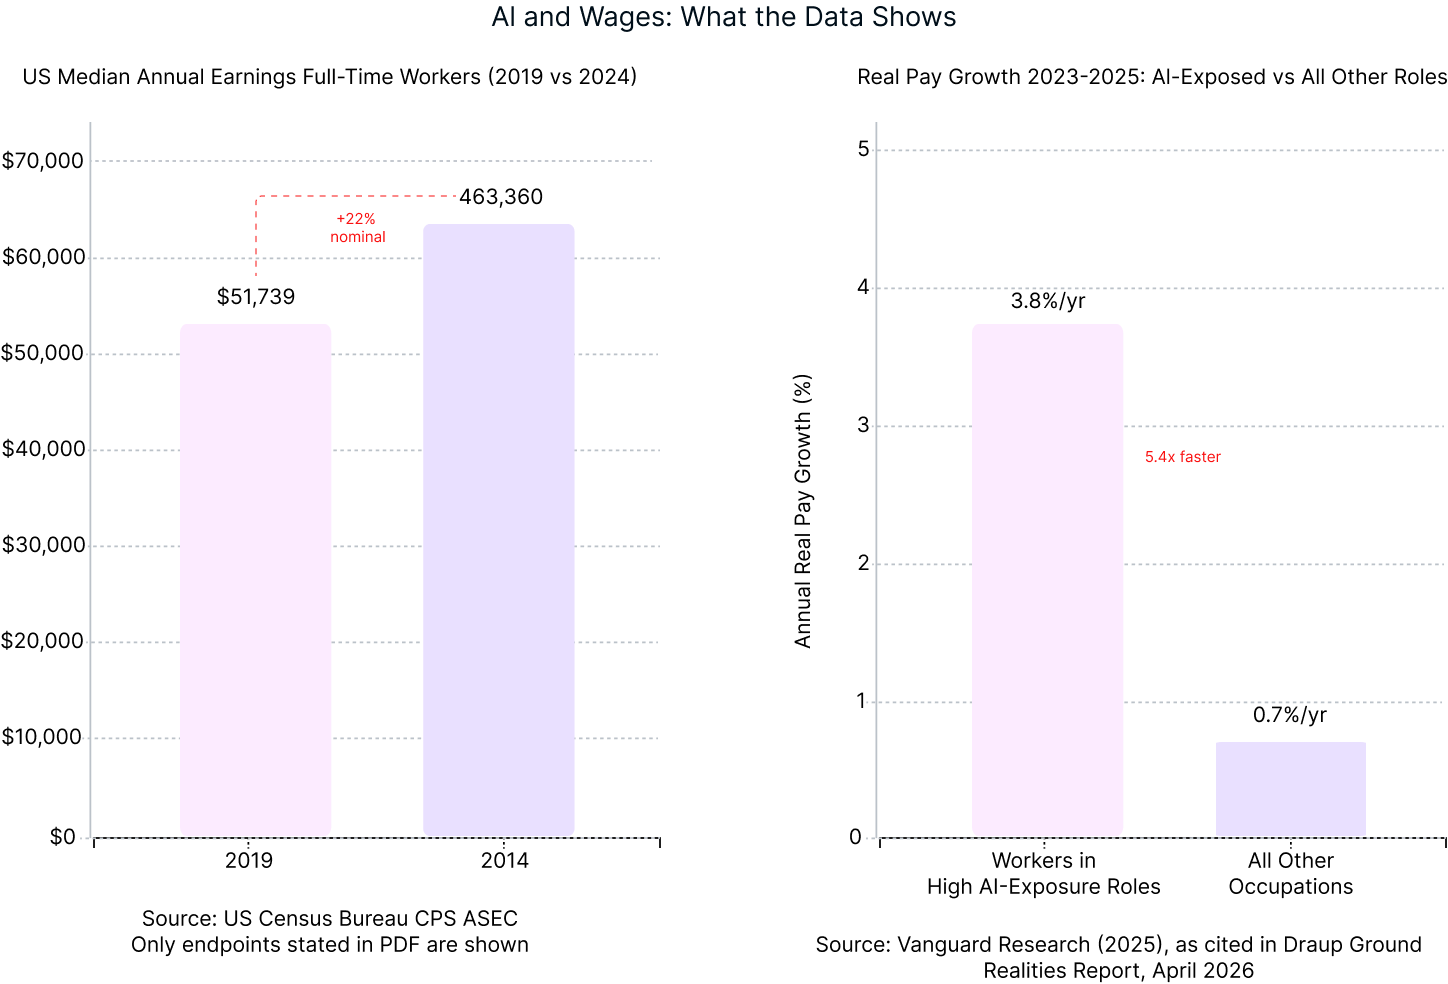
The prediction that AI would suppress wages by reducing the scarcity of cognitive labor has not materialized in the data. Across every portrait studied and in aggregate US earnings data, workers whose roles intersect with AI are seeing pay rise faster, not slower, than their peers.
Key Data Points:
What It Means:
The countries most exposed to AI automation have the tightest labor markets in the dataset. This is the clearest empirical test of AI displacement available over the past three years, and it does not support the claim. The AI risk map in most forecasting models is actually the formality map: higher-income countries show higher measured unemployment because they count informal workers as jobless. That structural measurement difference has nothing to do with AI.
Strategic Implications:
The Roles That Survive Require What AI Cannot Replicate
The Signal:
Across every portrait in Draup's research, the tasks AI absorbed were the most routine. The responsibilities that expanded were those requiring human judgment, relational trust, contextual interpretation, and accountability. MIT Sloan's EPOCH framework, Empathy, Presence, Opinion, Creativity, Hope, identifies the five capability clusters that correlate with role survival and wage growth in the AI era. Every portrait studied maps to one or more of these clusters.
Key Data Points:
- The paralegal firm: judgment about what matters in a document is the one thing AI cannot replicate but can scale. Older workers with tacit knowledge became the most valuable, not the most vulnerable.
- The customer support center: the 25% of tickets that require emotional handling now drive most of retention. Human agents are kept because empathy is not filterable upstream.
- The financial analyst: a new competency emerged from FCA oversight requirements, knowing when to trust the model and when to override it. Firms pay a premium for it.
- Employers now hire for the ability to direct, critique, and decide, not to research, summarize, and draft. Draup's fastest-growing hiring criteria are epistemic, not technical.
- AI Governance, Orchestration, and Integration skills showed growth rates 400 to 600% higher than AI Builder skills such as model training, deep learning, and neural networks in 2025 Fortune 500 postings.
- AI governance and model-risk skills are growing 81% year-over-year.
What It Means:
The EPOCH layer is not soft or peripheral. It is the binding constraint on what AI-assisted workflows can actually deliver. Roles that require these capabilities are seeing demand and pay grow faster than foundational AI research roles, which are growing more slowly as the model layer commoditizes. The skills market is already pricing this.
Strategic Implications:
How We Support Enterprise Workforce Intelligence
Draup's platform provides real-time, AI-powered talent and market intelligence that enables enterprises to anticipate workforce trends, optimize hiring strategies, and build future-ready talent architectures based on what is actually happening in labor markets, not what forecasting models predicted three years ago.
We analyze 25M+ data points daily from 75,000+ sources, including Fortune 500 postings, compensation benchmarks, skills demand signals, and field-level role evolution data. Our database covers 1B+ global job descriptions.
For Talent Leaders:
Access global labor market data to model skills demand, location strategies, and cost structures with real-time visibility into AI-driven role transformation. Move from forecast models to observed-data planning.
Identify the skills combinations that are actually growing in your sector, including AI-fluency premiums, EPOCH-layer capabilities, and governance competencies that standard job boards do not track.
Map internal capabilities against external market trends to address the skills gaps that matter, not the ones displacement models predicted, but the ones Fortune 500 postings are actually showing.
Track AI-fluency premiums and skills-density shifts in real time. Our pay intelligence layer covers 75,000+ sources and updates continuously so your compensation bands reflect the market that exists today.
Implications for Enterprise Decision-Makers
The AI and labor market patterns of 2024 and 2025 demand a reset in how workforce risk is framed:

The risk is distributional, not aggregate
Headline unemployment data does not show AI displacement. The risk is concentrated in narrow-task, low-skill roles at the bottom of the distribution, not across professional and knowledge work broadly.

Invest in the EPOCH layer proactively
The market is already repricing empathy, judgment, and creative reasoning upward. Workforce planning models that do not account for this are measuring the wrong gap.

AI governance and oversight hiring is a strategic, not compliance, decision
AI governance and model-risk skills are growing 81% year-over-year. This is a capability race with competitive consequences.

Early-career AI fluency is the highest-leverage hire of this cycle
Firms leading AI deployment grew entry-level technical hiring in both 2025 and 2026. The informal LLM experience new graduates bring is not replicable through training programs alone.

Do not wait for headline unemployment to signal trouble
By then, affected workers will have struggled for years. The right leading indicators are skills demand shifts, role-level task absorption, and pay premium divergence, all of which Draup tracks in real time.
Methodology and Analytical Framework
How We Derived These Insights
Macro Data Foundation
- Macro analysis draws on World Bank WDI (SL.UEM.TOTL.ZS) and ILO ILOEST modelled estimates, covering 217 countries from 1991 through 2024.
- 2025 and 2026 projections are ARIMA time-series forecasts based on ILO modelled estimates and BLS quarterly trend data.
- Wage analysis draws on US Census Bureau CPS ASEC for nominal and real median annual earnings, and Vanguard Research (2025) for the AI-exposure wage differential.
Ground Research Foundation
- Seven worker portraits constructed from Draup's proprietary database of 1B+ global job descriptions across Fortune 500 companies, compensation data, and field interviews conducted 2024 to 2025.
- Portraits were selected to represent a cross-section of AI-exposure levels, geographies, seniority levels, and sectors.
Skills and Demand Analysis
- Skills extracted using NLP models and mapped to Draup's proprietary skills ontology across 800M+ profiles and 450M+ job descriptions.
- AI-operator versus AI-builder skill segmentation based on year-over-year growth rate analysis of Fortune 500 postings, 2024 to 2025.
External Corroboration
- Dell'Acqua et al., HBS 24-013 (2023): AI and consultant performance distribution.
- Brynjolfsson, Li, and Raymond, NBER 31161 (2023): AI complementarity and customer support outcomes.
- WEF Future of Jobs Report 2025: 78 million net new jobs projection through 2030.
- Yale Budget Lab: No aggregate AI employment disruption through end of 2025.
- FCA UK AI governance and labor monitoring, 2025: No net reduction in qualified analyst roles.
- WHO Ethics and Governance of AI for Health, 2021 and 2024: Regulatory framework for AI in radiology.
Analytical Guardrails
- Insights reflect directional trends derived from observed data, not single-point observations.
- Percentage growth figures indicate relative change, not absolute hiring volume.
- Chart visuals in this document use only values explicitly stated in the source PDF. No intermediate or interpolated values are plotted.
Note: This page is structured as a decision guide for enterprise leaders evaluating workforce transformation strategies and market intelligence platforms. It does not represent investment advice or employment forecasting for specific organizations.

.svg)




.svg)
